
War and Interest Rates

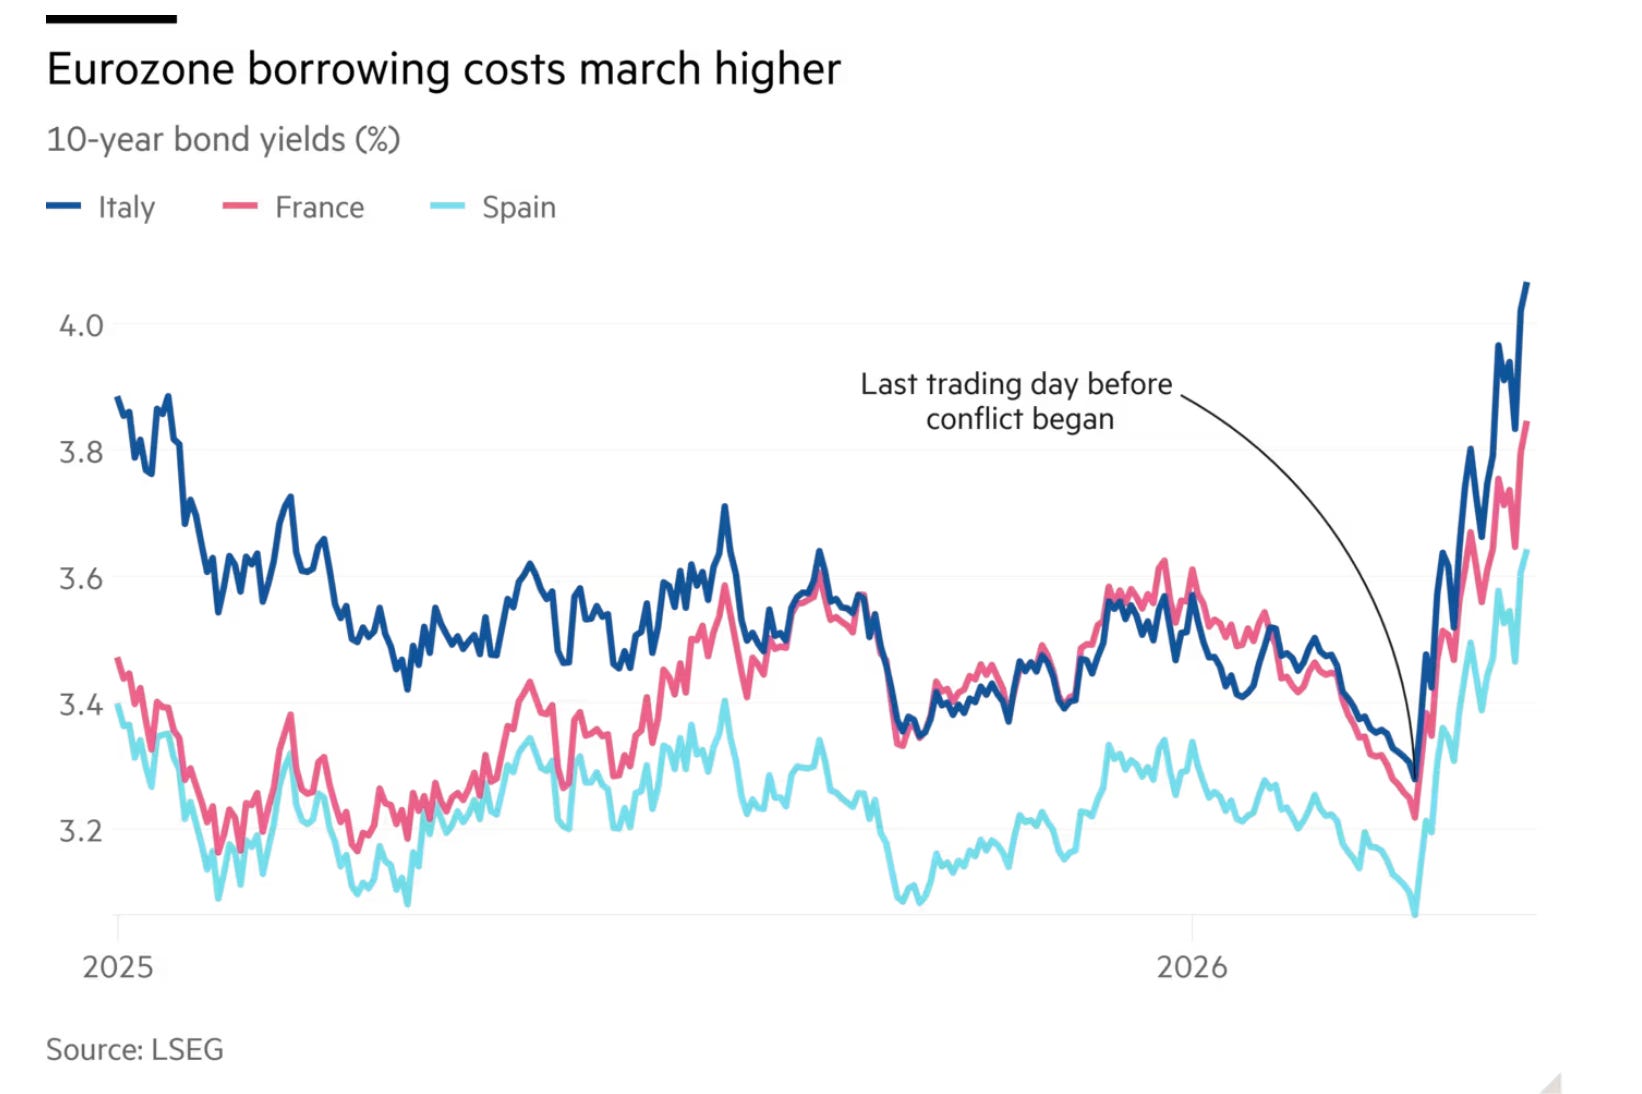
You knew about oil prices, discussed in a previous post. Now attention is turning to the sharp rise of long-term interest rates. From Ian Smith, Sam Fleming, and Olaf Storbeck in the Financial Times:
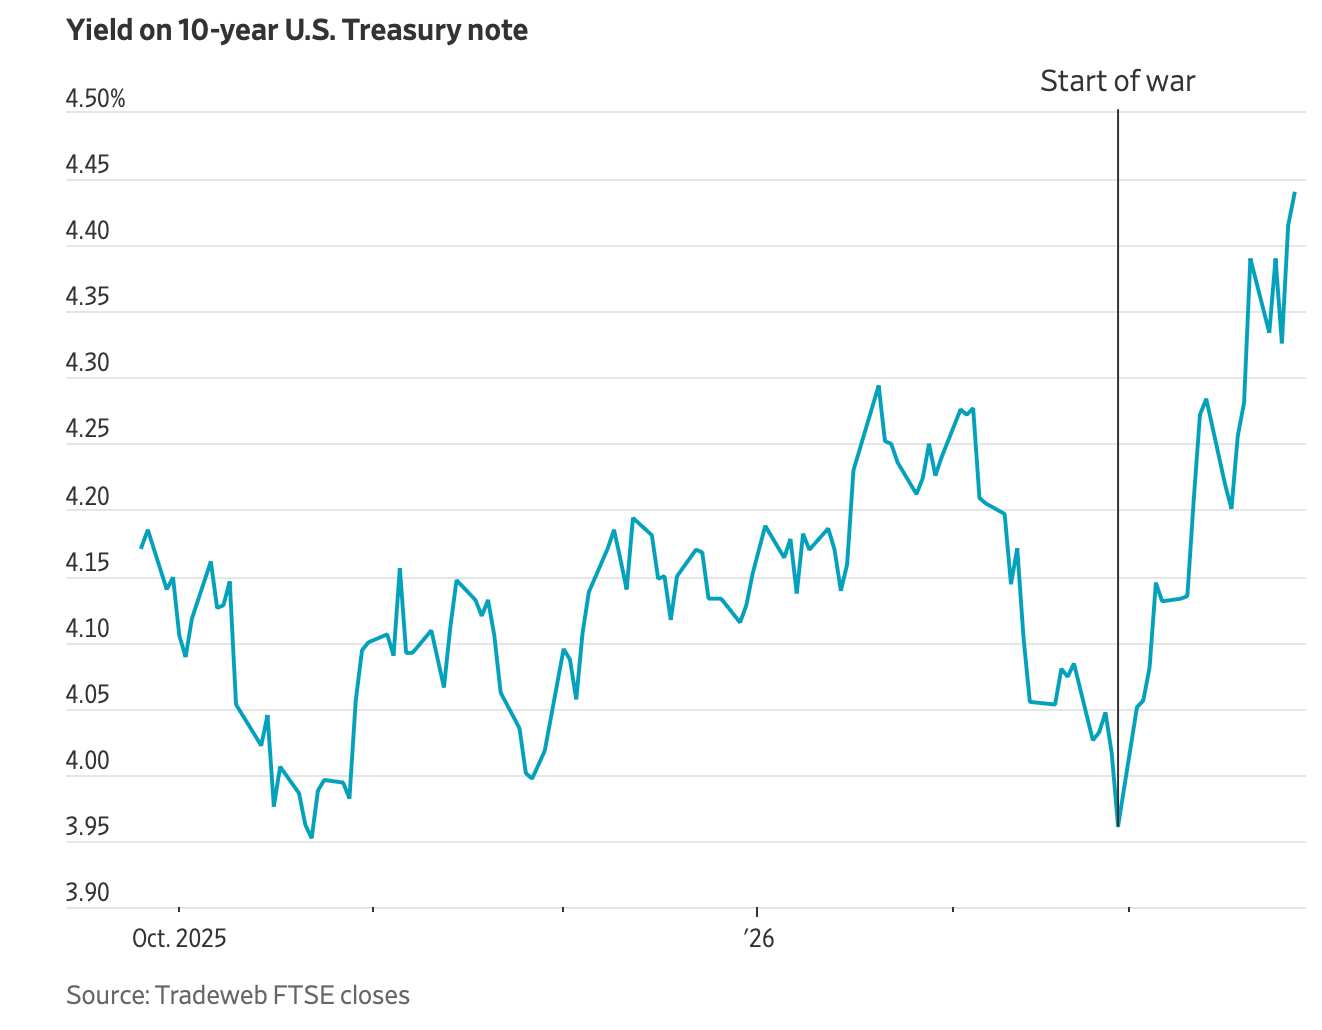
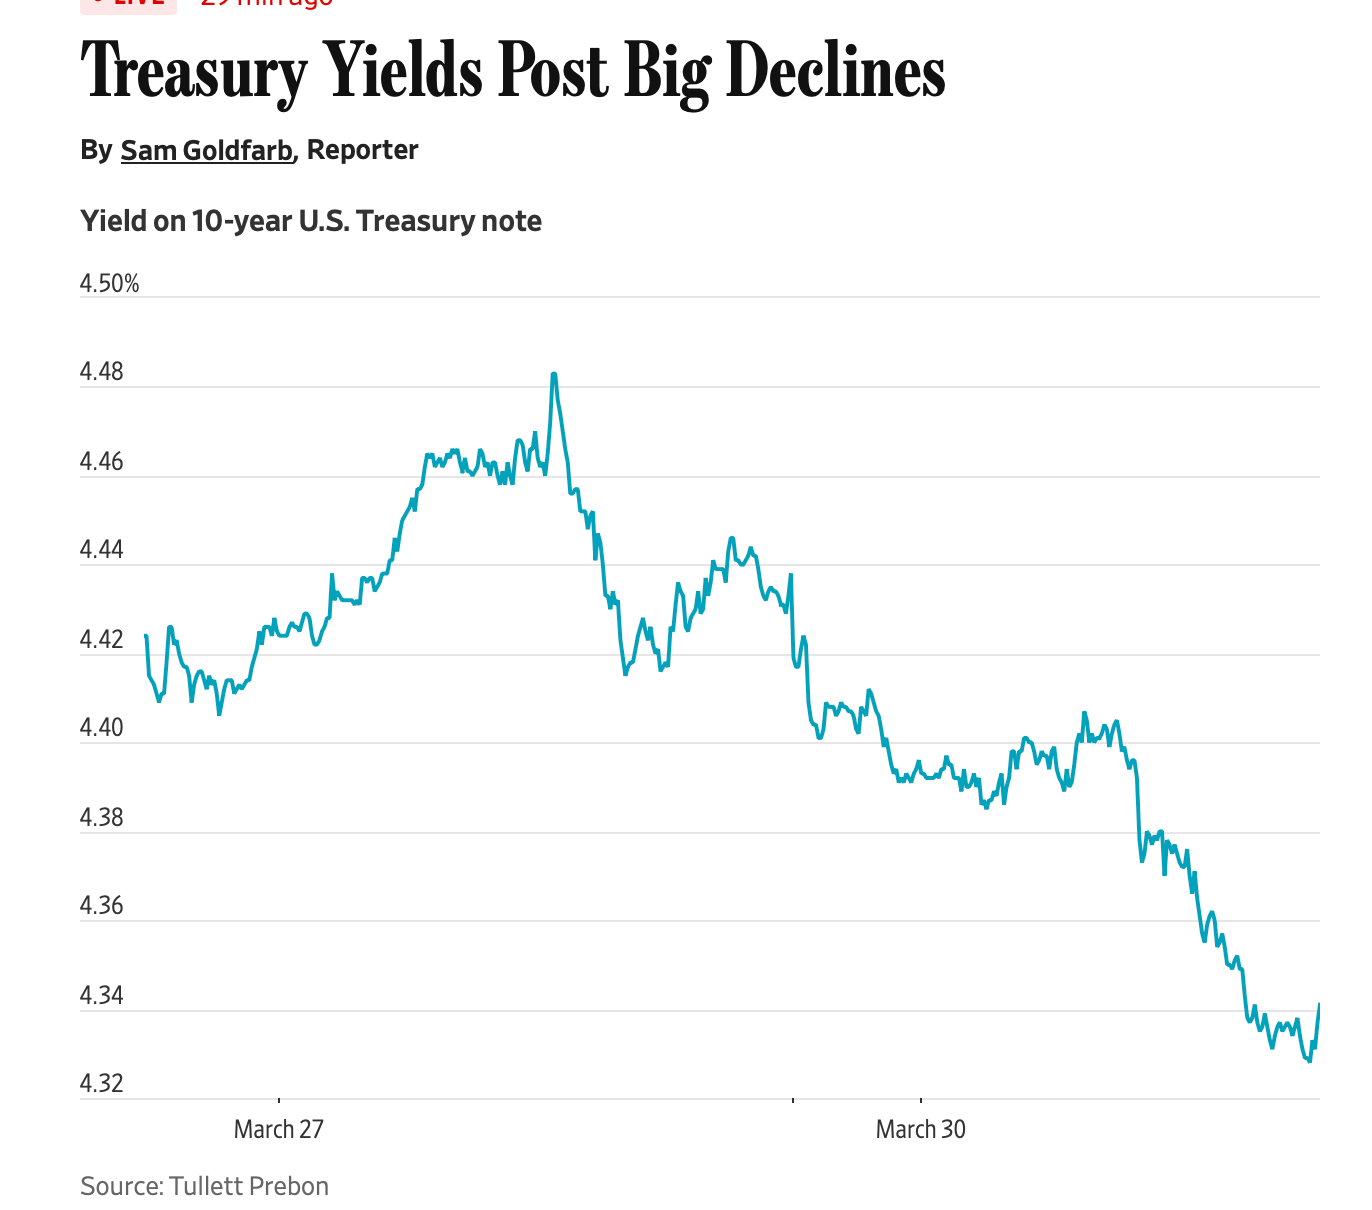
From Sam Goldfarb at the Wall Street Journal:
What’s going on? Broadly, there are three messages bonds might be sending.
1) Directly, people might be expecting more inflation. More expected future inflation leads to higher bond yields, as people demand a greater return when they expect bonds to be paid back in devalued money.
2) People might be expecting higher short-term interest rates in the future. When one way of getting money from now to 10 years from now, rolling over short-term bonds, looks better, the other way of doing so, buying a long term bond, should get better too.
3) The end is nigh. People might be losing faith in our governments’ abilities to borrow and repay debt, and want to get out now ahead of the catastrophe.
These are all related. If people expect more inflation, then they might expect central banks to raise short-term interest rates in response to that inflation. People might expect central banks to keep interest rates low, but then to have to raise them more later on to fight larger inflation. People might see fiscal profligacy as a threat to inflation.
Which is going on now?
The FT opines:
traders rushed to bet on the European Central Bank raising its benchmark interest rate three times this year to contain an expected burst of inflation.
“Investors are starting to realise that we are moving into a mix of lower growth and higher inflation, combined with more fiscal stimulus and higher government spending,” said Tomasz Wieladek, chief European macro strategist at T Rowe Price.
Investors are betting that public finances across the Eurozone “are going to deteriorate”, said Jean-François Robin, global head of research at Natixis CIB, as countries spend “a lot of public money” to absorb the shock.
Following the start of the previous energy crisis in September 2021, €651bn was allocated and earmarked across European countries, including the UK and Norway, to shield consumers from rising energy costs, according to the Bruegel think-tank.
An oil price shock does not necessarily mean inflation. It takes government policies to turn a relative price shock into inflation. See “how to turn a price shock into inflation.” So, the bet is that euro area governments will respond to the price shock by sending people money to pay for higher oil and gas bills, and that fiscal largesse will cause inflation. I am glad to see fiscal theory being taken up :) Europe is also taking about price controls and other ham-handed interventions.
They are also betting that the ECB will react promptly to any inflation, which accords with what I have heard. The ECB took a full year to react to the last inflation, and the ECB understands that people are more attuned to inflation, and their faith that the ECB will aggressively fight inflation is weaker.
The US is a bit behind Europe on ham-handed policy, but the temptation to make things “affordable” to individuals (not to the country) will be strong. The Trump administration just announced as 60% rise in corn ethanol mandates. When someone advocates “industrial policy,” answer “corn ethanol.” It doesn’t save CO2, it doesn’t save much oil (it takes a lot of petroleum to make corn), and it uses land and drives up food prices.
The Fed will be interesting. It’s hard to see the Fed doing anything decisive in its fraught interregnum. It’s hard. Central banks are used to meeting output and employment declines with lower rates. They see lack of “demand” as the source of the problem and provide it. But sometimes, as with an oil shock, the problem is lack of “supply.” The economy can’t produce as much. Adding stimulus in the face of an inflationary supply shock gives a lot more inflation and only a little bit less bad output, at least in the conventional understanding of such things. Politically, restrictive monetary policy while governments are trying to “stimulate” is tough. I fear the Fed will try to square the circle with a big “quantitative tightening” rather than raise rates. The 1979 credit controls were a similar ill-fated effort. Darrell Duffie explains why balance-sheet reduction is hard and can cause financial damage. Much more coverage later.
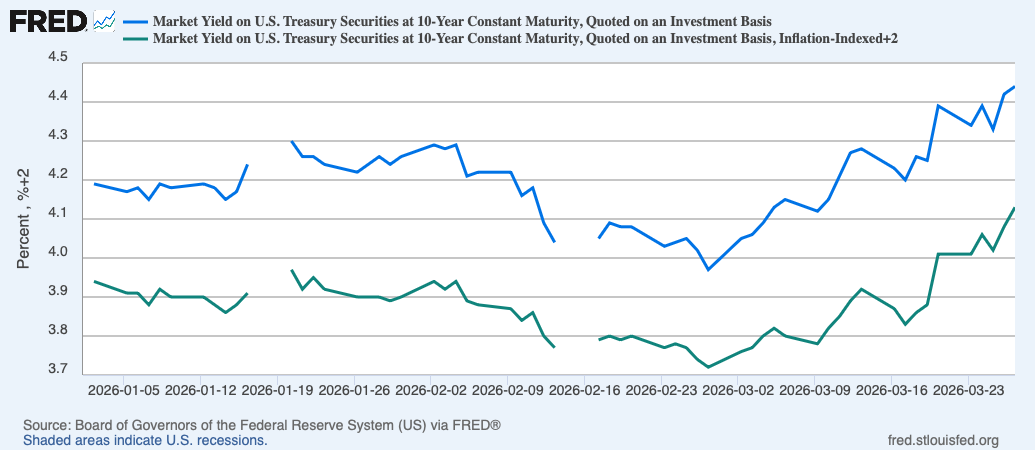
To investigate a bit what’s going on, I plotted here the path of 10 year Treasurys along with 10 year indexed Treasurys. The lower line is shifted up by 2% so they fit on the graph together. This graph suggests that we are not seeing a direct inflation premium. Higher expected inflation would directly raise the Treasury yield leaving the inflation-protected yield alone. So the lower line is forecasting higher real interest rates. It may be forecasting that the Fed will raise interest rates, and prices being sticky that won’t have an effect on inflation. If it’s the end of the world, (I don’t think so) that would be an end with explicit write-down, and we are seeing a default premium, not a premium for default via inflation.
These graphs are also not suggesting a forecast recession, the point I’ve been debating with Niall Ferguson on Goodfellows lately. That would be revealed by lower real and nominal interest rates.
But first let’s get a grip. When I first made the interest rate graph, it popped up with a greater horizontal axis
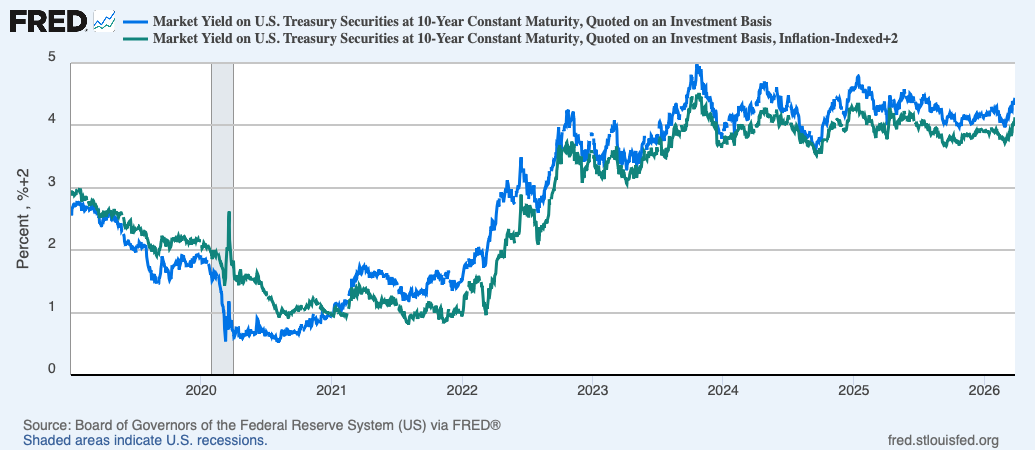
What happened to the recent “spike?” It’s there, just put in perspective about just how bit it is compared to the usual ups and downs. So, hold on, maybe it’s not time to grab those gold bars and shut the bunker door quite yet. Moral: Always read the axes.
Sam Goldfarb, who wrote the Wall Street Journal graph on Saturday, added “Some fear the selling has taken on a momentum of its own, with the war-fueled market swings forcing hedge funds to shed bonds to cover bets made with borrowed money and other investors hesitant to step in while the threat of further losses linger.”
As I was looking up the reference Goldfarb posted
Yes,
Look at the axis again: another decimal point on the left, and the last day worth of data on the right.
Moral: The life of a markets reporter is not easy! Neither is the life of a bond trader. The life of a grumpy substacker is much easier : )
it is interesting that media and pundits keep comparing to 2022 where the combined fiscal profligacy and loose monetary policy induced a demand shock. it seems to me here we are in a complete different scenario with a supply shock that is destroying demand. so the bond market reaction seems an overshooting unless bond vigilantes are truly back and sending a clear message about not monetizing debt. Most probable scenario will likely be CBs owning public debt and let inflation run above targets. Ordinary citizens will pick up the tab but nothing different from the last 100 years.
After a decade in commodity trading and risk management, this is one of the cleanest treatments of the supply shock policy dilemma I've read anywhere, and the framing of why central banks struggle when the conventional demand-side toolkit doesn't fit the problem captures something most current commentary refuses to acknowledge. The 1979 credit controls comparison is particularly sharp.Professor Cochrane's point about the political economy of restrictive monetary policy during a supply-driven crisis is the part that deserves more attention than it's getting in current Fed coverage. The institutional incentive to "do something" with stimulus when the actual problem requires restraint is exactly the failure mode that produces the worst outcomes, and the historical pattern is unambiguous.The piece I'd add from the physical commodity side is operational color on why the supply shock is harder to wait out than financial markets currently assume. The inflation impulse from the current crisis is already locked into the supply chain through contractual mechanisms that operate on 60 to 90 day lags. The freight surcharges have been renegotiated. The fertilizer purchases that determine fall harvest costs have been priced at current natural gas levels. The refining contracts have been signed at elevated crude prices. None of this reverses if the Hormuz situation resolves tomorrow, because the contracts are already in place and will flow through to consumer prices over the next two quarters regardless of where spot commodity prices trade. This timing characteristic matters for the bond market analysis in the post because it suggests the market may be pricing exactly what your Treasury graphs are showing. If the lower line is forecasting higher real interest rates rather than a direct inflation premium, the market is implicitly pricing the Fed's eventual restrictive response to inflation that's already in motion through the supply chain. The market knows the inflation is coming through commodity transmission. The Fed's interregnum is preventing it from acting on what the supply chain has already determined. The watch item from the physical side that connects to your Treasury market framework: dated Brent assessments and freight rate indices are leading indicators for the CPI prints that will arrive 60 to 90 days later. When dated Brent stays elevated and the dated Brent versus front-month futures spread remains wide, the supply chain is locking in additional inflation that financial markets are only beginning to acknowledge. The Treasury market is starting to price this. The policy response hasn't caught up. The post's broader point about always reading the axes is the kind of analytical discipline that separates serious work from headline reaction, and it's one of the things I appreciate most about The Grumpy Economist. Sophisticated framing combined with willingness to puncture overstated narratives is rare in current macro commentary.