Maybe the price puzzle and NK model are right after all
I recently ran in to a lovely paper by Neil White at Amherst, “The new Keynesian Price Puzzle: Reinterpreting Inflation Dynamics.” This post is closely related to my last one on the Lucas Phillips curve and that line of work.
Here is White’s Figure 1. These are four famous VARs that measure the effects of monetary policy. On the left you can see how the Federal Funds Rate responds to a shock. Conceptually, suppose the Fed wakes up one day, raises interest rates, and then keeps interest rates persistently high following the pattern shown in the left hand graphs. Vector autoregressions (VARs) try to measure what happens to other variables after that shock. The middle graph shows each estimate of what happens to the price level. Notice that in each case the price level goes up for a while after the rise in interest rates. Moreover, when the price level eventually goes down, interest rates have also gone down past their initial level. It sure looks like higher rates raise inflation!
This is the “price puzzle” that has bedeviled empirical work on monetary economics since Christopher Sims inaugurated VARs in 1980. It’s a “puzzle” because, of course, everybody thinks that higher interest rates lower inflation and the price level. Lots of torturing, or refining, depending on your point of view, of the estimates followed to try to make it go away.
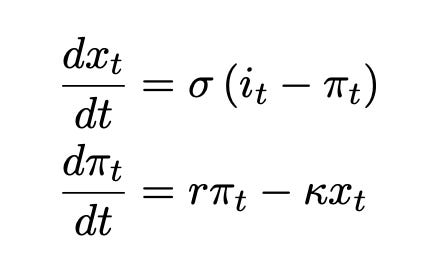
The third column is the model. Here Neil just looked hard at the solution of the standard new-Keynesian model. The response functions are (my notation, continuous time)
with x = output, i = interest rate, pi = inflation. The solution is
Inflation is a two-sided moving average of interest rates with positive weights, plus an initial transient. You can index the transient by initial inflation too. So, “indeterminacy:” Interest rates alone are not enough to determine inflation. You have to characterize policy by an interest rate path and initial inflation.
White takes the path of interest rates from the left hand graph, initial inflation from the middle graph, and plugs those into the solution above, using textbook parameters, to compute what the model says inflation should be. The model produces inflation as shown in the right hand graph. The two equation new Keynesian model fits darn well! But it predicts what the data show, that higher interest rates (plus the equilibrium selection we see in the data) raise inflation.
How did others think that higher interest rates lower inflation, and that the price rise is a puzzle? By forcing a large negative initial inflation or C. All that is in both his and my paper.
This is a really pretty result. Maybe higher interest rates on their own do lower inflation. But if so, both the actual equations of the textbook theory of the last 30 years and the actual empirical results of the last 40 years are wrong, and they agree with each other. I’m not sure which is right, but there is a big tension here between what economists say and what both model and data say. It’s fun to have such fundamental puzzles to think about.


I mean, am I the only one to notice the widely different scale used in the third column of plots compared to the second one? There may be qualitative resemblance, but claiming that the NK model is consistent with the VAR responses seems a bit exaggerated.
A few things come to mind:
1. What happens when you use your new model instead of the textbook NK model?
2. Martin Uribe (2022) had this paper identifying long-run vs short-run interest rates shocks. Permanent changes being conflated with transitory ones in interest rates is another possible resolution of the puzzle. It would be nice to see something like that too, but you’d need to include this in the theory to compare cleanly. It doesn’t resolve your point that the mechanism isn’t the aggregate demand story we invoke — but it might change the sign.
3. You can basically eliminate the price puzzle if you use a Divisia monetary aggregate (Keating et al., 2019). Nothing says the fundamental surprise needs to match the policy instrument. Josh Hendrickson also has a paper with Ronald Mau (2022) where they show a particular rule for monetary policy is equivalent to a particular money demand, so you can write the same NK model both ways. Like fiscal policy, money demand is always there even if they didn’t write it down.
I know the point you’re making here is to raise the possibility that conventional wisdom is just ignoring what data and theory has been screaming at us for years. Still, a price puzzle is far from necessary.