Monetary-Fiscal Interactions
This is an essay that developed out of a presentation at the 2024 SOMC conference at Hoover. pdf here, which you may need if your email cuts off the end.
I admit to much recycled content, as I chew things over and try to find the best and most effective way to think about and communicate the basic issues. The essay captures my standard FTPL popular talk.
The Recent Inflation
We have just lived through a bout of inflation greater than anything since 1980, after which US inflation was supposedly conquered.
Figure 1. Inflation and the federal funds rate.
Inflation broke out suddenly in February 2021, as illustrated in Figure 1. Where did inflation come from? The Federal Reserve, remarkably, did nothing for a full year, leaving interest rates at zero. Yet inflation did not spiral upward. Inflation eased just as the Fed lifted interest rates off zero. Why did inflation ease? Standard doctrine says that interest rates must rise above inflation to push inflation down, with a big recession as in 1982. Yet inflation came down on its own despite interest rates below inflation, and with no hint of economic slowdown. As I write, inflation is still persistently above 2%. When will it finally end? Or will inflation resurge, as it did following a similar situation in 1976?
A Fiscal-Theory Interpretation
As a fan of the fiscal theory of the price level (Cochrane 2023), I find it gives simple answers to all of these questions, except of course the last—inflation will always be hard to forecast. But it also says that inflation should be hard to forecast. If we knew prices would go up tomorrow, we’d try to buy, sending prices up today.
In the COVID-19 pandemic, the US spent nearly $5 trillion, mostly in the form of checks to people and businesses. The Fed monetized about $3 trillion of that. Not all of that spending was inappropriate. The government did have to face the economic emergency posed by the pandemic and lockdowns. But spend it did.
More significantly, in my view, fiscal policy did not return to normal, or normal levels of dysfunction, after the pandemic waned. The Biden administration passed an additional $2 trillion stimulus in February 2021, quickly followed by the CHIPS Act, the hilariously named Inflation Reduction Act, and more. Unprecedented deficits continued.
The fiscal theory of the price level gives a framework to understand how this fiscal blowout caused inflation. It states that the price level adjusts so that the real value of nominal debt equals the present value of primary surpluses (taxes less spending, not including interest costs on the debt) that pay back the debt. If stockholders see that dividends are unlikely to support the value of their stock, they try to sell, and drive down the stock price. If bondholders think that the US will not run surpluses sufficient to repay its debts, the bondholders try to sell too. They try to exchange bonds and money for goods and services, driving up the price level. Eventually the real value of debt is inflated back to what people think the government will repay.
Equivalently, inflation comes from too much money chasing too few goods. The government can fight inflation by soaking up money with taxes greater than spending. The government can also fight inflation by soaking up money with bond sales, the classic open market operation. But people are only willing to hold more debt if they think future taxes will exceed spending to repay that debt. So the government can soak up money with current or future taxes in excess of spending. Lacking those, the money causes inflation.
The fiscal theory does not say that debt and deficits always cause inflation. It says only that debt and deficits cause inflation when they are greater than expected future repayment. And that repayment can take decades. Figure 2 illustrates.
Figure 2. Three paths for deficits. X axis is time, Y axis is dollars, adjusted for inflation.
In normal and responsible fiscal policy, the government borrows to finance an emergency such as a pandemic, a war, or a deep recession, or to invest in productive capital such as the interstate highway system. Then, the government pays off that debt with small surpluses over decades. The left-hand panel of Figure 2 illustrates this pattern. This pattern causes no inflation—the present value of surpluses and deficits does not change.
Well-managed government debt is a good and great thing. It allows governments to meet temporary spending needs without enormous taxes. It allows governments to spread the cost over decades. Governments that can borrow, by effectively promising repayment, can marshal great resources. The left panel of Figure 2 is what we should expect to see most of the time—debt and deficits in bad times, paid off by surpluses in good times, and little or no inflation.
Trouble brews in the middle panel of Figure 2. Here the same debt or deficit is not matched by convincing promises of future surpluses. The present value of surpluses declines, and inflation breaks out. This is what I think happened in 2021–23.
The right-hand panel of Figure 2 alerts us to another danger. Even without any current debt or deficit, people can lose faith that the government will repay debt. Inflation springs seemingly out of nowhere. Investors lose faith and a stock can fall for no apparent reason. Inflation, roughly stock in the government, can suffer the same fate.
These observations provide some discipline. It is not enough to point to debt and deficits; we must also ask why people did not expect them to be repaid, causing inflation. These observations also help us to address the obvious questions, since most debt or deficits do not correspond to inflation: What’s different about this time? Why now, but not in 2008?
There is a plausible argument that people this time did not think additional debt and deficits would be repaid this time, while they did previously. In 2008, the government promised stimulus now, debt reduction to follow. Some,including myself, chuckled at deficit-reduction promises that always seem to take effect one day after the incumbent leaves office, but at least the government had the decency to make the promise. Nothing like this happened in 2020–23. Congress suspended the PAYGO rules that require cuts in some spending when there are increases in other spending. The zeitgeist was r < g, MMT, secular stagnation, don’t worry about debt repayment. Treasury Secretary Yellen, arguing for the American Rescue Plan Act in 2021, said the US should “go big” and not worry about debt, as interest rates were low.
In this interpretation, the deficits of the early Biden administration are particularly significant. The COVID deficits could be seen as classic emergency spending, with an expectation to return to normal fiscal policy to repay that spending when it was over. The huge spending bills of 2021 signaled that this would not happen. That inflation eased in summer 2022, when it became clear that additional multi-trillion spending bills would not pass, is also significant.
The present-value view also points to discount rates, equivalently interest costs on the debt, as a driver of inflation. A one-percentage-point higher interest cost on the debt is, with 100% debt-to-GDP ratio, the same thing as a1%-of-GDP additional deficit. Following 2008, the US enjoyed nearly a decade of negative real interest costs, with 0% short-term rate and inflation averaging just below 2%. A negative 2% real interest cost makes a lot of debt sustainable!
The latter mechanism is a serious constraint on monetary policy going forward. Each percentage point of higher real interest rates, undertaken to fight inflation, raises interest costs by 1%, and at 100% debt-to-GDP ratio raises interest costs by 1% of GDP. If Congress does not provide those extra funds, that’s an inflationary pressure, offsetting any good that higher interest rates do on inflation.
The bottom line: In 2021–23, people holding $5 trillion of new government debt asked themselves, “Is this a good investment, to save and hold for the future? Or should I get rid of it fast while I can, and try to spend it?” They chose the latter, until inflation brought the value of debt right back to where it was at the beginning.
Fiscal theory is not just story telling. We write models, quantitative parables of the economy. Models don’t prove an idea right, but if you can’t write a model, the idea is usually wrong. A model makes sure that the logical ends are tied up, that you respect budget constraints and markets clear.
Figure 3. Response of a standard new Keynesian model with fiscal theory to a fiscal shock, with no interest-rate response by the central bank.
Figure 3 presents a model simulation. I write a simple textbook new Keynesian sticky price model, augmented with fiscal theory. I ask the model what happens if the government runs a 1%-of-GDP deficit, with no plan to repay the debt, and if the central bank leaves interest rates alone.
(The model is the continuous time version of
where x is the output gap, i is the nominal interest rate, 𝜋 is inflation, v is the real value of government debt, r is the nominal return on the portfolio of government bonds, s is the real primary surplus scaled by the value of debt, q is the price of government bonds, and 𝛚 describes the geometric maturity structure of government debt.)
Figure 3 presents the response to a 1% change in surplus. In response to this fiscal shock, inflation surges. Plotting inflation as change from a year earlier, as it is conventionally calculated in data, inflation grows for a year. Inflation above the interest rate slowly eats away at the value of government debt. In a model without price stickiness, this shock would lead to an instant 1% price level rise, removing that much value from government debt. With sticky prices, the long period of inflation above the interest rate accomplishes the same thing, with the price level rising after a few years. If the government spends, someone has to pay for it. If current taxpayers or future taxpayers do not pay for it, then it must come from the pockets of bondholders, through default, or here via inflation.
The plot answers the first puzzle of 2021: Inflation surged, even though monetary policy did nothing unusual. Why? That’s what happens in response to an unfunded fiscal expansion.
In the simulation, inflation then eases and fades away, even with no reaction at all by the central bank. In conventional doctrine, the central bank must raise interest rates above inflation, and cause a recession, in order to first keep inflation from spiraling away and then to beat inflation back. In this model, in response to this one-time fiscal shock, once the price level has risen enough to inflate away debt, the force for further inflation is spent. Inflation goes away on its own even if the central bank does nothing. This accords with the puzzle of 2022, that inflation peaked and eased before central banks moved at all, and came back down long before interest rates exceeded inflation, and without any recession.
Central banks are still important in fiscal theory.
Figure 4. Response of a simple new Keynesian model to an interest-rate shock, with no change to primary surpluses. The model includes long-term debt.
Figure 4 presents the response of the same model to a rise in interest rates with no change in fiscal surpluses. Inflation declines initially, though it rises in the far future. With no change in fiscal policy, monetary policy can only lower inflation by moving it through time. The Fed faces what I call unpleasant interest-rate arithmetic. There must be some inflation to devalue debt, but the central bank can choose when it happens, and whether losses falls on long- or short-term bond holders.
Responding to the fiscal shock of Figure 3 by the monetary response of Figure 4 is a good thing to do. It leads to a smaller but longer-lasting inflation, which has smaller output effects. Central banks did err, if they did not want inflation, by not raising interest rates sooner. A Taylor-rule-like response remains a very good policy to follow.
Figure 4 holds primary surpluses constant. Standard new Keynesian solutions of this model produce greater inflation declines, but they do so by “passively” inducing a fiscal policy contraction (the negative of Figure 3) along with the interest rate rise. In Figure 4, I ask what the central bank can do by itself, without inducing tighter fiscal policy.
So, central banks did help to bring inflation down faster than otherwise would have occurred, but at the cost of a slightly more stubborn medium-run inflation. That too is roughly consistent with the facts.
How do other theories of inflation deal with the recent surge and decline?
Money
After forty years in the desert of monetary policy, monetarists are crowing that monetary aggregates such as M2 rose substantially ahead of the recent inflation. Is money the answer?
The view that the price level is determined by the money supply (MV=PY) suffers a fundamental theoretical flaw: It requires that the central bank control the money supply. If the bank does not do so, by following an interest-rate target or otherwise letting money supply be endogenous, MV=PY determines M, not P. Our central bank does not make any effort or pretense of controlling the money supply.
But facts are more important than theoretical complaints. How do fiscal theory and monetarism compare on the facts? Fiscal theory and monetarism agree: A helicopter drop of base money causes inflation. In fiscal theory, money is just very short-term government debt. But if a helicopter drop came with an announcement that taxes would rise tomorrow, just enough to soak up all the extra money, would there still be inflation? Probably not, no?
Fiscal theory and monetarism disagree on a different question: What if the government exchanged $5 trillion of money for $5 trillion of debt? To a monetarist, money is money: This experiment has exactly the same effect as giving people $5 trillion of money. To a fiscal theorist, the exchange has no first-order effect at all. There is no “wealth” effect of money, just a second-order “portfolio composition” effect.
Indeed, most of the famous examples suggesting that money causes inflation result from money printed to finance deficits. When has too much money caused inflation for a government whose economy was growing smartly, and whose fiscal affairs were in good order, but whose central bank bought too many bonds?
Wouldn’t it be lovely if the government were to run an experiment for us? First, exchange $3 trillion of money for debt. Buy $3 trillion of bonds, and issue $3 trillion new reserves in exchange. (Banks can freely exchange reserves for cash.) See what inflation this causes. Second, after that has settled down, print up $3 trillion of new money, and hand it out. (Technically, use it to buy government debt, and let the Treasury hand out the cash.) Handing money out counts as transfer payments and adds to the budget deficit. Monetarism says that these two operations should have exactly the same inflationary effect. Fiscal theory says that only the second will cause any inflation.
Our government just ran just about exactly this experiment. Figure 5 illustrates. In the quantitative easing era, the Fed bought more than $4 trillion of bonds in three great waves of bond purchases. You can see this in the “Fed assets” line. Reserves, a Fed liability, increased the same amount. Before 2008, reserves were below $50 billion. To a monetarist, this nearly hundredfold increase in money should have caused hyperinflation. As seen in the “core CPI” line, this massive open market operation had no visible effect at all on inflation.
Figure 5. Federal funds rate, core CPI, and Fed assets.
During and after the COVID-19 pandemic, the Fed bought a similar amount of treasuries, raising reserves even more, but this time to fund a deficit without plans for debt repayment. This operation caused a wave of inflation, peaking at 8%.
It is rare in macroeconomics to be handed such a decisive experiment of such a fundamental prediction that distinguishes theories.
Supply Shocks and Other Stories
Our politicians reacted to inflation with a rousing “round up the usual suspects:” monopolists, greed, price gouging, hoarding. More seriously, many economists and central bankers blamed “relative demand” and “supply shocks” (or “supply-chain shocks” if you want to sound fancy) for inflation. People rotated demand from restaurants to Pelotons, driving up the price of Pelotons. Production and importation of all sorts of durable goods were hampered by the pandemic.
All of these stories confuse relative prices with the price level. If you can’t get chips to make TVs, or can’t make TVs because the factory is locked down, or if everyone suddenly wants a TV, TV prices must go up relative to restaurant prices or to wages. We must all get the signal to buy fewer TVs. But why do TV prices go up, rather than wages or restaurant prices go down? Why does the price of everything go up?
Inflation is a rise in the price level. It occurs when the common component of all prices goes up. One cannot raise the price level by raising all prices relative to each other!
Inflation always comes from demand. Loosely speaking, we must have the money to pay the higher prices for TVs and the higher prices for restaurants.
Now supply and relative-demand shocks were part of the story. When there is a relative-price shock, some prices must go up relative to others. The government prefers that prices do not go down, on the view that wage and price declines are more economically damaging than wage and price rises. So the government “accommodates” the relative price shock with monetary or fiscal largesse, so that no wages or prices have to actually decline. Hence, in an order-of-events sense, yes, the supply shock led to the inflation. But the supply shock is the carrot that led the horse of monetary and fiscal policy to pull the cart of inflation. But the carrot didn’t move the cart, the horse did. In the chain of causality, one might equally say that it is the pandemic that caused inflation, since it caused the supply shocks which caused the demand response which caused the inflation. Or one might say that a lab leak in China caused the inflation. But people would notice how silly it is to say “Lab leaks cause inflation.” Well, supply shocks are no different.
This point is hidden in standard models. In most new Keynesian models, such as the one I wrote down above, each equation has shocks. In particular, modelers write the Phillips curve as:
They call the disturbance u a “supply” shock. Well, you can see how a rise in u is likely to produce a rise in inflation 𝜋. And a formal accounting will find that shocks to this equation do, in fact, account for much of the observed inflation. (Smets and Wouters [2024] is a good example.) This is not an independently measured economic event, it is merely a name for our ignorance.
But you still have to ask: How do people get the money to afford the higher prices? Where is the nominal anchor? New Keynesian models do have a nominal anchor, either money supply or fiscal theory. In some treatments, the central bank issues more money in order to follow the interest-rate target. In others, it issues more government debt. These are hidden in footnotes. But somebody has to move the nominal anchor! A “supply” shock without movement in the nominal anchor doesn’t cause inflation. Inflation only comes from a move in that underlying nominal anchor.
Monetary-Fiscal Interactions
How do monetary and fiscal policies interact, especially looking forward to the possibility of renewed inflation in the shadow of large ongoing debts and deficits?
Higher interest rates are thought to lower inflation. But higher interest rates make fiscal matters worse, through three channels. First, higher real interest rates mean higher interest costs on the debt. This is a first-order effect: At 100% debt-to-GDP ratio, a one-percentage-point higher interest rate means that the deficit rises by one percentage point of GDP due to interest costs on the debt. Second, if higher interest rates successfully lower inflation, nominal bondholders receive a windfall, being paid back in more valuable currency. Equivalently, nominal payments do not decline, but nominal tax revenues do decline when inflation declines. Tax revenue must rise or spending must decline to make up the difference. Third, the whole mechanism by which higher interest rates lower inflation is via a softer economy. But a softer economy—or even a recession—leads to financial bailouts, “automatic stabilizer” payments such as unemployment insurance, lower tax revenue due to lower GDP, and deliberate fiscal stimulus programs.
Thus, higher interest rates pour fiscal gas on the inflation fire, offsetting whatever other inflation-lowering effects they may have.
In all conventional models of monetary economics, a monetary contraction includes higher taxes and lower spending, either immediately or in the future to pay off larger debt, in order to pay these additional fiscal costs. It’s not accurate to call them “monetary” models of disinflation; they are “monetary-fiscal” models of disinflation, because both monetary and fiscal policy (in present-value terms) tighten to produce disinflation.
This joint monetary fiscal policy is easy enough to see: Look at the plots of real interest rates. If real interest rates rise following the shock, there are higher interest costs on the debt. If inflation goes down, bondholders are paid a windfall. Someone has to pay for these costs, and that someone is taxpayers, or recipients of lower spending!
Conversely, what if fiscal authorities do not cooperate, and refuse to raise taxes or lower spending? This is a relevant policy question as well as a theoretical question. A government may not be able or willing to tighten fiscal policy to support monetary policy.
In all current models, higher interest rates that are not accompanied by a fiscal tightening (either immediately or in the future, i.e. a rise in the present value of surpluses) do not lower inflation. We are left with the frightening possibility that most of what we thought of as the “effect of interest rates” was in fact the effect of induced fiscal tightening, and that central banks may be powerless without that tightening.
Figure 6. Effect of a monetary policy shock in the standard new Keynesian model. Left: AR(1) monetary policy shock. Right: shock reverse-engineered to produce the same interest-rate path, but no change in fiscal policy.
Figure 6 documents this claim for the standard new Keynesian model. This is the perfectly standard three-equation model, with no fiscal-theory funny business:
In the left-hand panel, I plot the standard exercise, the response of interest rates and inflation to a shock to an AR(1) disturbance. The interest rate rises, and inflation declines. What do you mean, monetary policy alone can’t lower inflation?
Look again. The nominal interest rate is above the inflation rate. The real interest rate has risen, and with it, interest costs on the debt. Who paid those higher interest costs? The first-period lower inflation is a windfall to short-term bondholders. Who paid for that? In every new Keynesian model there is a footnote about passive fiscal policy, usually that lump-sum taxes come in to pay any of these costs. It is uncommon to actually calculate what those lump-sum taxes are, or to wonder what happens should they not materialize. Here I calculate those taxes, for a 100% debt-to-GDP ratio. The answer is that primary surpluses rise by 2.2% of GDP. This is a joint monetary-fiscal disinflation.
What can monetary policy do without fiscal help? The right-hand panel answers this question. In this model there are multiple disturbance paths that produce the same interest rate path . I reverse-engineer a different disturbance path that produces the same AR(1)-shaped interest-rate path as in the left-hand panel, but requires no increased fiscal surpluses from the “passive” fiscal policy—no lump-sum taxes, please. So, by construction, the path of observed interest rates is the same in the left- and right-hand panels.
(The path of disturbances includes both an interest-rate policy, the observed path of interest rates, and an “equilibrium-selection” policy. Many different disturbance paths and many different inflation paths are consistent with a given interest rate path. The choice of the disturbance path among those that generates the same interest rate path selects one of those inflation paths. The change in disturbance here changes the equilibrium-selection part without changing the interest rate path.)
Inflation is different in this simulation. The same observed interest-rate policy, without fiscal support, produces a different inflation. And that inflation rises. As promised, higher interest rates without a contemporaneous fiscal tightening do not lower inflation, even in this completely standard new Keynesian model. It is specified and solved in the entirely standard way. I just read and calculated the footnote about lump-sum taxes.
Intuitively, you see that inflation is tied to the interest-rate path, reducing interest costs on the debt. With no change in surpluses, the sum of interest costs on the debt equals the devaluation of outstanding debt by first-period inflation. You can see how an early period of positive interest costs is matched by a later period of lower interest costs. The initial inflation also amounts to a partial default on outstanding debt to pay for the somewhat larger average interest costs.
This example is taken from Cochrane (2024), which investigates many other examples to make the same point: There is no parameterization of the three-equation model in which higher interest rates lower inflation without fiscal support.
Figure 7. Disinflation in an adaptive-expectations model. Source: Cochrane (2024).
Even in the traditional adaptive-expectations model, higher interest rates cannot lower inflation without fiscal support. Figure 7 displays an example. The model is a traditional adaptive-expectations model. There are no forward-looking terms in the IS curve. Everywhere that there should be a rational-expectations , I use past inflation instead. The model is the continuous-time version of
I simulate the response to a permanent rise in monetary policy disturbance. Inflation declines. As inflation declines, via the Taylor rule, the interest rate follows along, so we end up at a new lower steady-state inflation. This is an embodiment of the standard story told of the 1980s. What do you mean there is no model of a monetary disinflation?
Look again. There is a long period of high real interest rates. Bondholders get paid off in more valuable money. Who pays? If nobody pays, the graph tracks the discounted value of the debt. That value grows forever, meaning that the transversality condition is violated. Without tighter fiscal policy, this is not the answer. Fiscal policy must also tighten to create this answer.
In Cochrane (2024), I work out how inflation responds to interest rates in this model when fiscal policy does not change. The answer is, no path of interest rates can permanently lower inflation without a fiscal tightening. The intuition is straightforward: Higher real interest rates lower inflation, and lower real interest rates raise inflation. But the average real interest rate must be zero if the average change to interest costs of the debt are zero. You can’t push inflation down without positive average real interest rates.
Figure 4 is the best I can do for an economic model of monetary disinflation by higher interest rates without a fiscal tightening. Inflation is temporarily reduced, but comes back in the end.
What about the 1980s, you ask? Isn’t that the paradigmatic case of monetary tightening that vanquished inflation—despite even the notorious “Reagan deficits”? No, that too was a joint monetary, fiscal, and microeconomic reform.
Figure 8. Inflation and the federal funds rate in the Great Inflation and disinflation.
Figure 8 presents inflation and the federal funds rate in the Great Inflation and disinflation of the 1970s and 1980s. There were three great surges of inflation. In each event, the Federal Reserve did raise interest rates, and more promptly than it did in 2022. In 1975, inflation eased despite interest rates that fell before inflation fell, another puzzle for standard doctrine. The quiescent period of 1977, with inflation easing but still persistent, may be an ominous reminder of the present moment. Inflation then surged through 1980. The Fed raised interest rates once, and retreated in the face of a sharp recession. The Fed raised rates again, to nearly 20%, and left rates high through a bruising recession. Inflation finally came down by the mid-1980s.
In its conventional interpretation, this is the paradigmatic episode for strong monetary policy, in the form of persistently high interest rates, pushing down inflation. It is usually interpreted through the old Keynesian dynamics of Figure 7.
But that isn’t the whole story. Notice in Figure 8 a decade of high real interest rates. These are high interest costs on the debt. Who paid those? Notice that investors who bought bonds at the high yields of 1980 were paid off in dollars worth a great deal more than expected, after inflation fell to 2.5%. Who paid that windfall? Who paid for the deficits induced by the recessions of 1980 and 1982?
Figure 9 presents the ratio of primary surplus to outstanding debt. In fiscal theory,
surplus relative to debt outstanding is the central measure of the inflationary impact of a surplus, just as total dividends relative to the value of stock outstanding measures the effect of dividends on prices.
Figure 9. Primary surplus divided by federal debt held by the public.
The deficits of the early 1970s and mid-1970s were quite large relative to debt, suggesting a fiscal impulse for inflation. To our focus on disinflation, however, note that the large deficits of the early Reagan years were in fact not quite so large primary deficits, especially when one considers the huge recession of the time. Much of the deficit that attracted attention at the time was higher interest costs on the debt. And then surpluses surged. In fiscal theory terms, the present value of surpluses on the right-hand side, the answer to “Who paid?”, is simple: Taxpayers paid. By the 2000s, economists were writing papers about what to do when the federal debt was paid off.
The 1980s included a range of fiscal reforms as well as tight monetary policy. The years 1982 and 1986 saw huge tax reforms that lowered the top marginal rate from 70% to 28%, while broadening the base. A Social Security reform put that program on a sound footing for several decades—a particularly noteworthy reform for the present value of surpluses. Fiscal theory is not about current deficits, remember, it is about faith in the government’s ability and will to repay debt and run sober fiscal policy over decades. Deregulation, or at least an absence of further regulation, spurred economic growth. For these and other reasons, economic growth accelerated. Tax revenue equals tax rate times income, and higher income generates fiscal surpluses more reliably than any other means.
To emphasize this point, Figure 10 plots the total surplus relative to the amount of debt, along with the unemployment rate. United States surpluses and deficits are driven almost entirely by the business cycle, not the widely ballyhooed changes in tax or spending policies. This graph also documents my contention that the “Reagan deficits” were not unusually large given the state of the business cycle.
Figure 10. Total surplus divided by federal debt held by the public, and the negative of the unemployment rate.
The present value of surpluses did pay for the disinflation of the 1980s. That’s an identity, really, as the right-hand side of the fiscal theory holds generally when discounting by the government bond return. But it’s good to see the elements of that identity. Surpluses did rise, to pay higher interest costs of the debt, the windfall to bondholders, and the extra debts of the 1980–82 recession. The 1980-84 period represented a joint fiscal, monetary, and microeconomic reform, not monetary policy acting alone. It is a mistake to look at this experience and infer what the Fed can do whenacting all by itself.
But 1980 had a 25% debt-to-GDP ratio. We now face 100% debt to GDP. We face expectations of a far larger bailout and stimulus in any recession. A bipartisan Social Security and health expense reform seems a distant political dream. Can the Fed count on this sort of fiscal support if it needs to repeat 1982 to stop the next inflation? The history of Latin America is full of instances in which central banks tried to stop inflation without fiscal cooperation. Inflation fell briefly, then surged again (Kehoe and Nicolini 2021). Will the US Congress, or European governments, sit still for central banks raising their interest costs by multiple percentages of GDP, or will the financial repression of the early post-WWII-era return?
The Future
Figure 11 reproduces the Congressional Budget Office’s (CBO) long-term debt and deficit projections.
These are projections, not forecasts or conditional expectations. This will not happen. The CBO says as much, by labeling the debt path “unsustainable.” They are projections of what will happen under current law, plus economic assumptions. The only question is how the future will differ from these projections.
Figure 11. Congressional Budget Office long-term projections. Black lines are author art illustrating what may happen in future crises.
The CBO projections are optimistic, in that they assume nothing bad ever happens again. The economic projections do not include the once-in-a-century crises that we seem to have every decade now. Note that the recent run-up in debt happened in two waves: the 2008 financial crisis and the 2020 COVID expansion. The next crisis will surely have a similar effect. So, under current law, something like the black lines is a more likely projection.
The problem is not debt. We can pay off even a 100% debt-to-GDP ratio if we return to small surpluses and strong economic growth. Conversely, if we continue to run 5%-of-GDP primary deficits forever, even defaulting or inflating away the debt will not solve the problem. Indeed, that would make the problem worse: After inflation or default, who will lend us the annual 5% of GDP? The problem is that structural deficit.
The conventional worry is that the indicated smooth path will eventually lead to inflation or debt crisis. I worry about a sharper scenario: What happens in the next crisis? Suppose, say, that China invades Taiwan. Pacific trade stops; a gigantic financial crisis and global recession break out. Our government would want to borrow or print, say, $10 trillion, to bail out, to stimulate, to keep people and businesses afloat, and, this time, to quickly fund military expenses. And all the time, entitlements remain unreformed, and the US throws trillions down various ratholes. Who will give $10 trillion of savings to the US government, believing it will be repaid? Will the experience of 2021–23, in which the same investors took a roughly 10% haircut due to inflation, not weigh on their faith? Will they say no, provoking an even quicker inflation? Will the US even be able to borrow that much? The loss of fiscal space is more worrying than a slow march of full-employment surpluses.
On a smaller scale, the same lack of fiscal capacity is what threatens a coordinated monetary-fiscal reform to contain inflation, should it break out. If there is no fiscal space to pay higher interest costs on the debt, monetary policy is unlikely to be able to lower inflation.
Returning to somewhat normal fiscal policy is not economically difficult. Our economies do not face external threats. Again, pro-growth economic policy is easier than tax hikes or spending cuts. Everything that raises GDP raises tax revenue.
References
Cochrane, John H. 2023. The Fiscal Theory of the Price Level. Princeton University Press.
Cochrane, John H. 2024. “Expectations and the Neutrality of Interest Rates.” Review of Economic Dynamics 53: 194 –223.
Kehoe, Timothy, and Juan Pablo Nicolini, 2021. A Monetary and Fiscal History of Latin America, 1960–2017. University of Minnesota Press.
Smets, Frank, and Raf Wouters. 2024. “Fiscal Backing, Inflation, and US Business Cycles.” CEPR Discussion Paper 19791, CEPR Press.


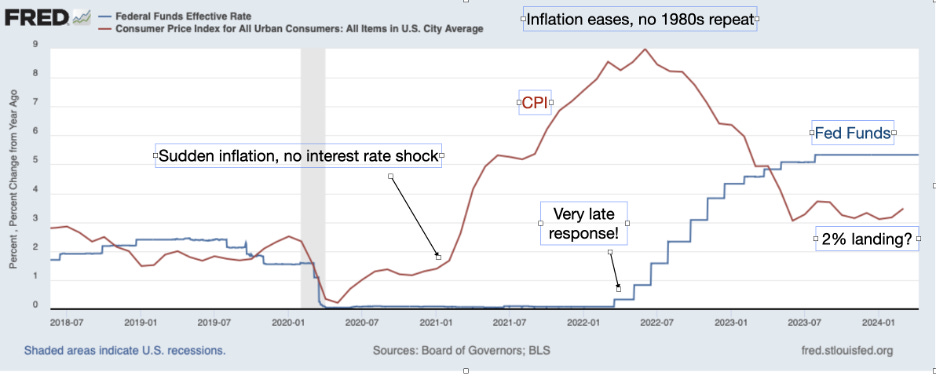

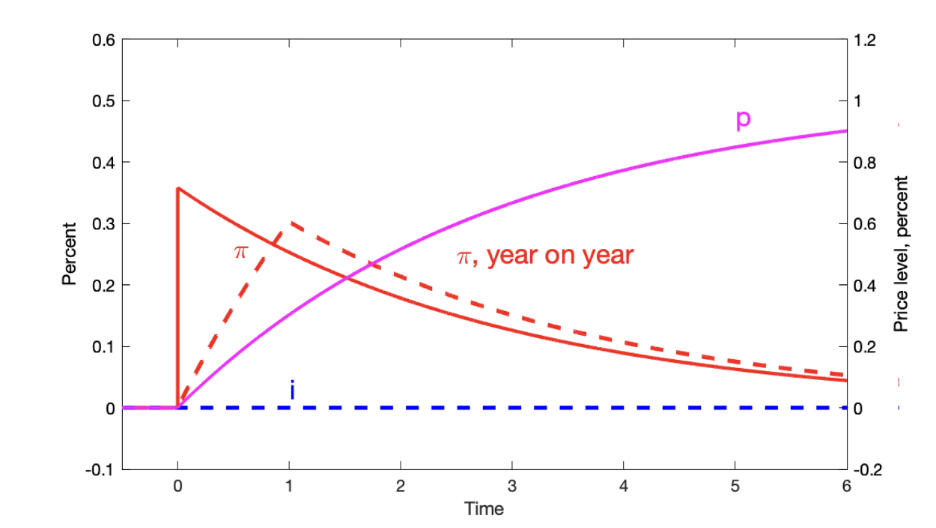
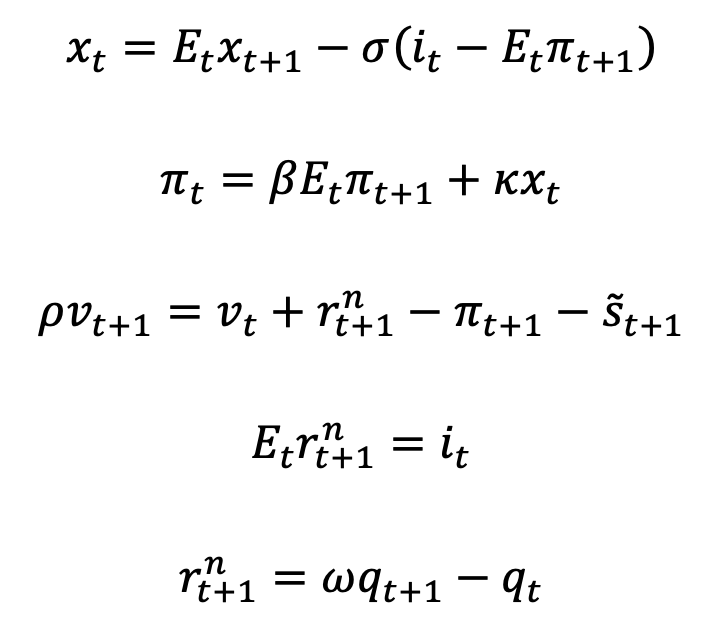
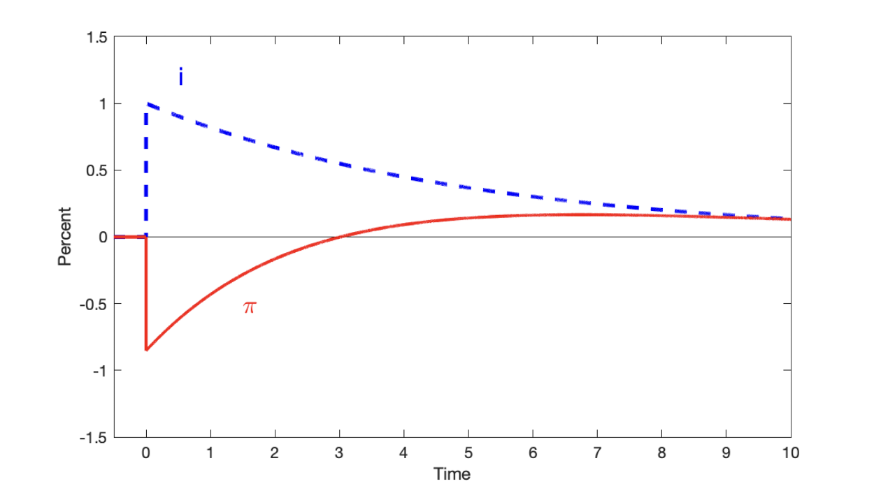
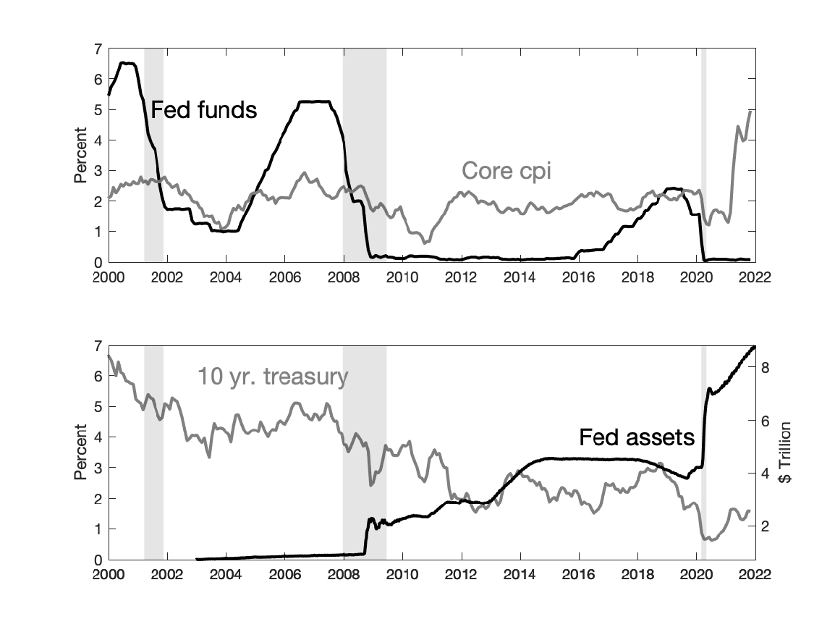

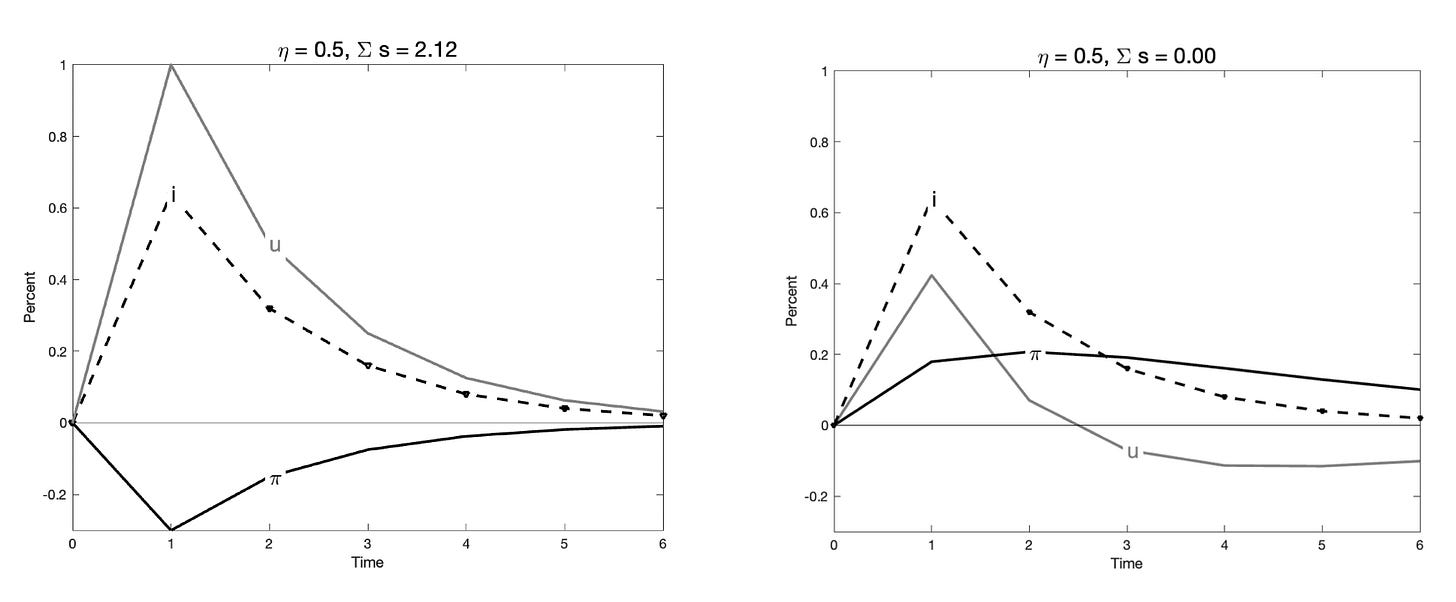
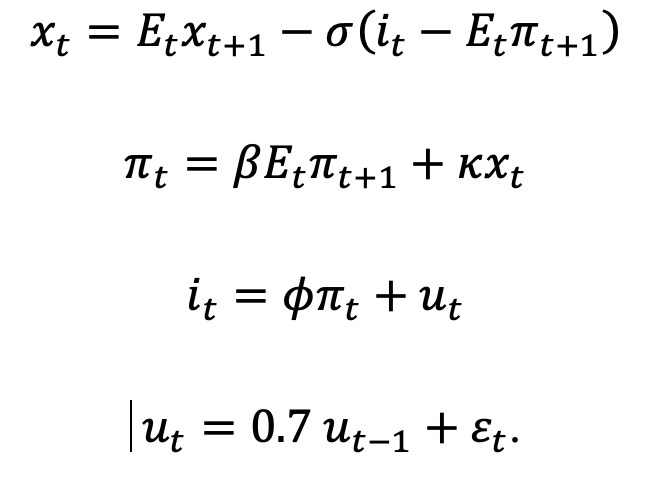

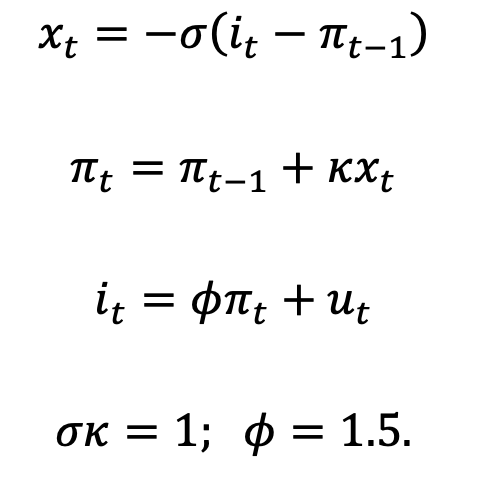

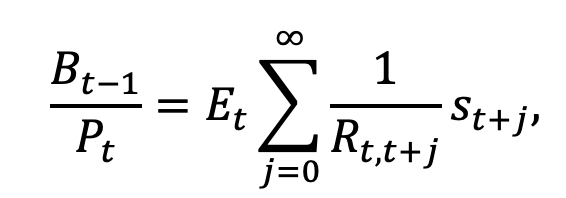
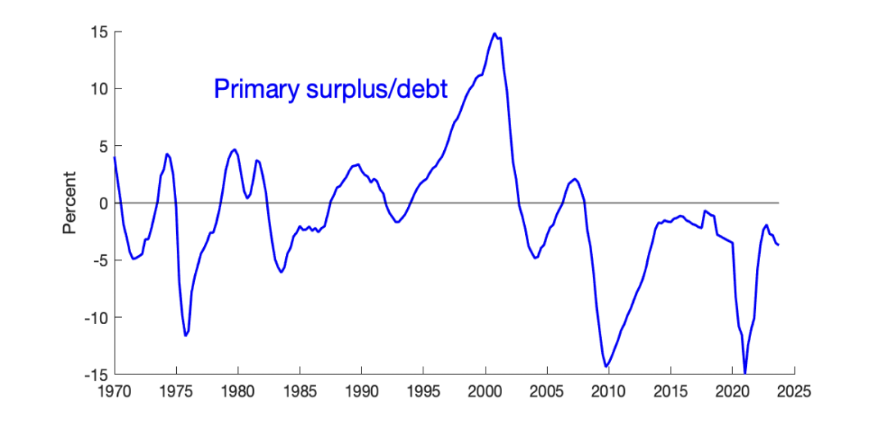
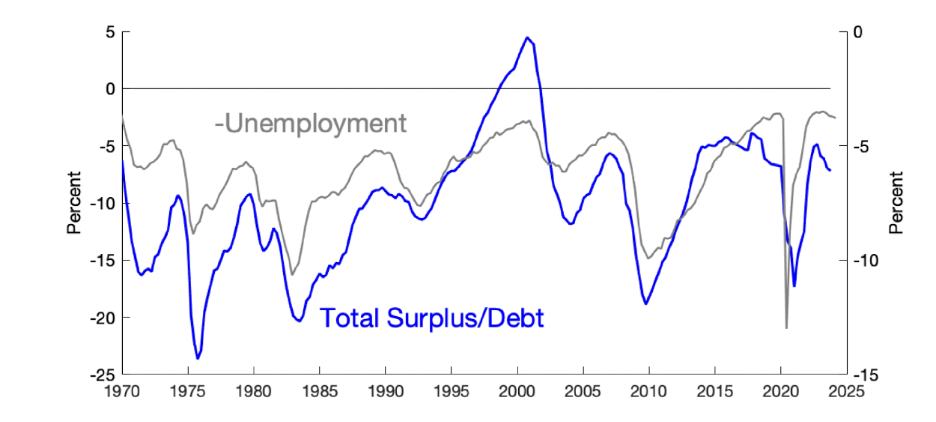
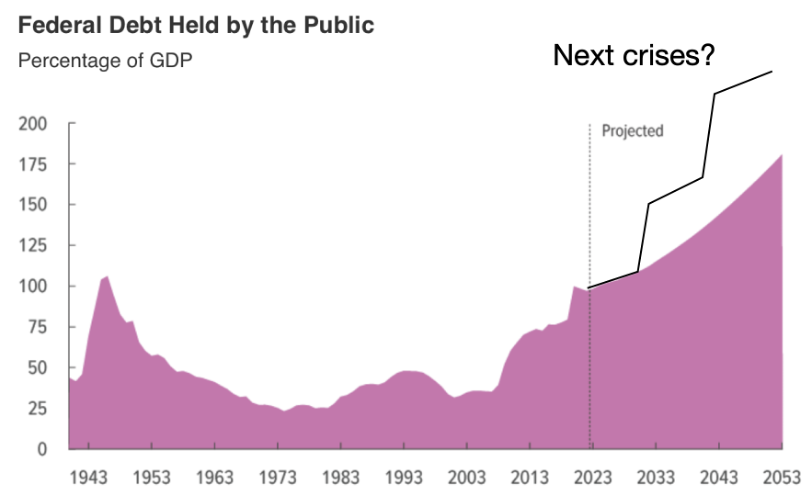
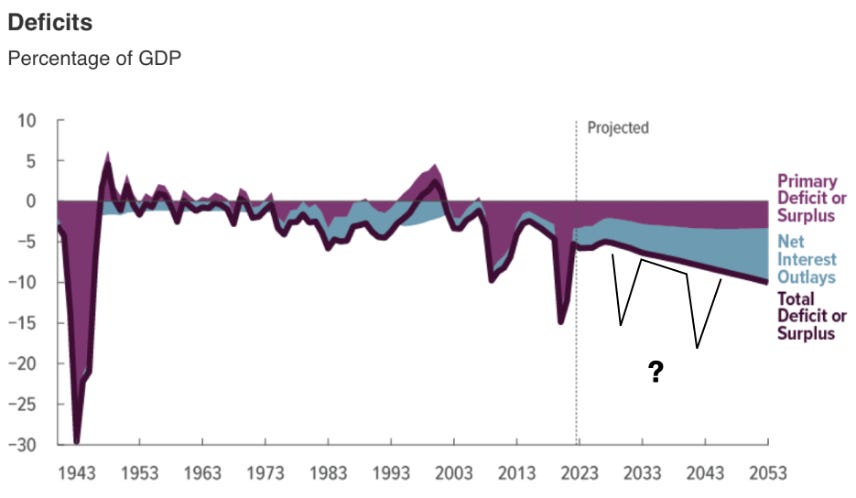
Figure 4 is now corrected. (I mistakenly had pasted figure 3 twice). Thanks to all for pointing it out.
Your monetarism experiment is apples to oranges. The first case is merely QE, which we know accomplishes little. The description of the second case omits an important step, namely the Treasury issuing $3 trillion of securities and depositing them in household bank accounts. QE raises bank reserves. Treasury deposits to our bank accounts raise M2 (adding QE to this as you assume wouldn’t change anything). Monetarists could argue that the increase in bank reserves don’t do much in an abundant reserves system but increases in M2 do and, in particular, the spike in 2021 explains, with long and variable lags, the inflation spike of 2022-3.