
Inflation and the Value of Money

Marijn Bolhuis, Judd Cramer, Karl Schulz, and Larry Summers have a very nice new NBER working paper on inflation.
Here is the current measure of inflation along with what inflation would be if the BLS computed the cost of housing as it did before 1983:
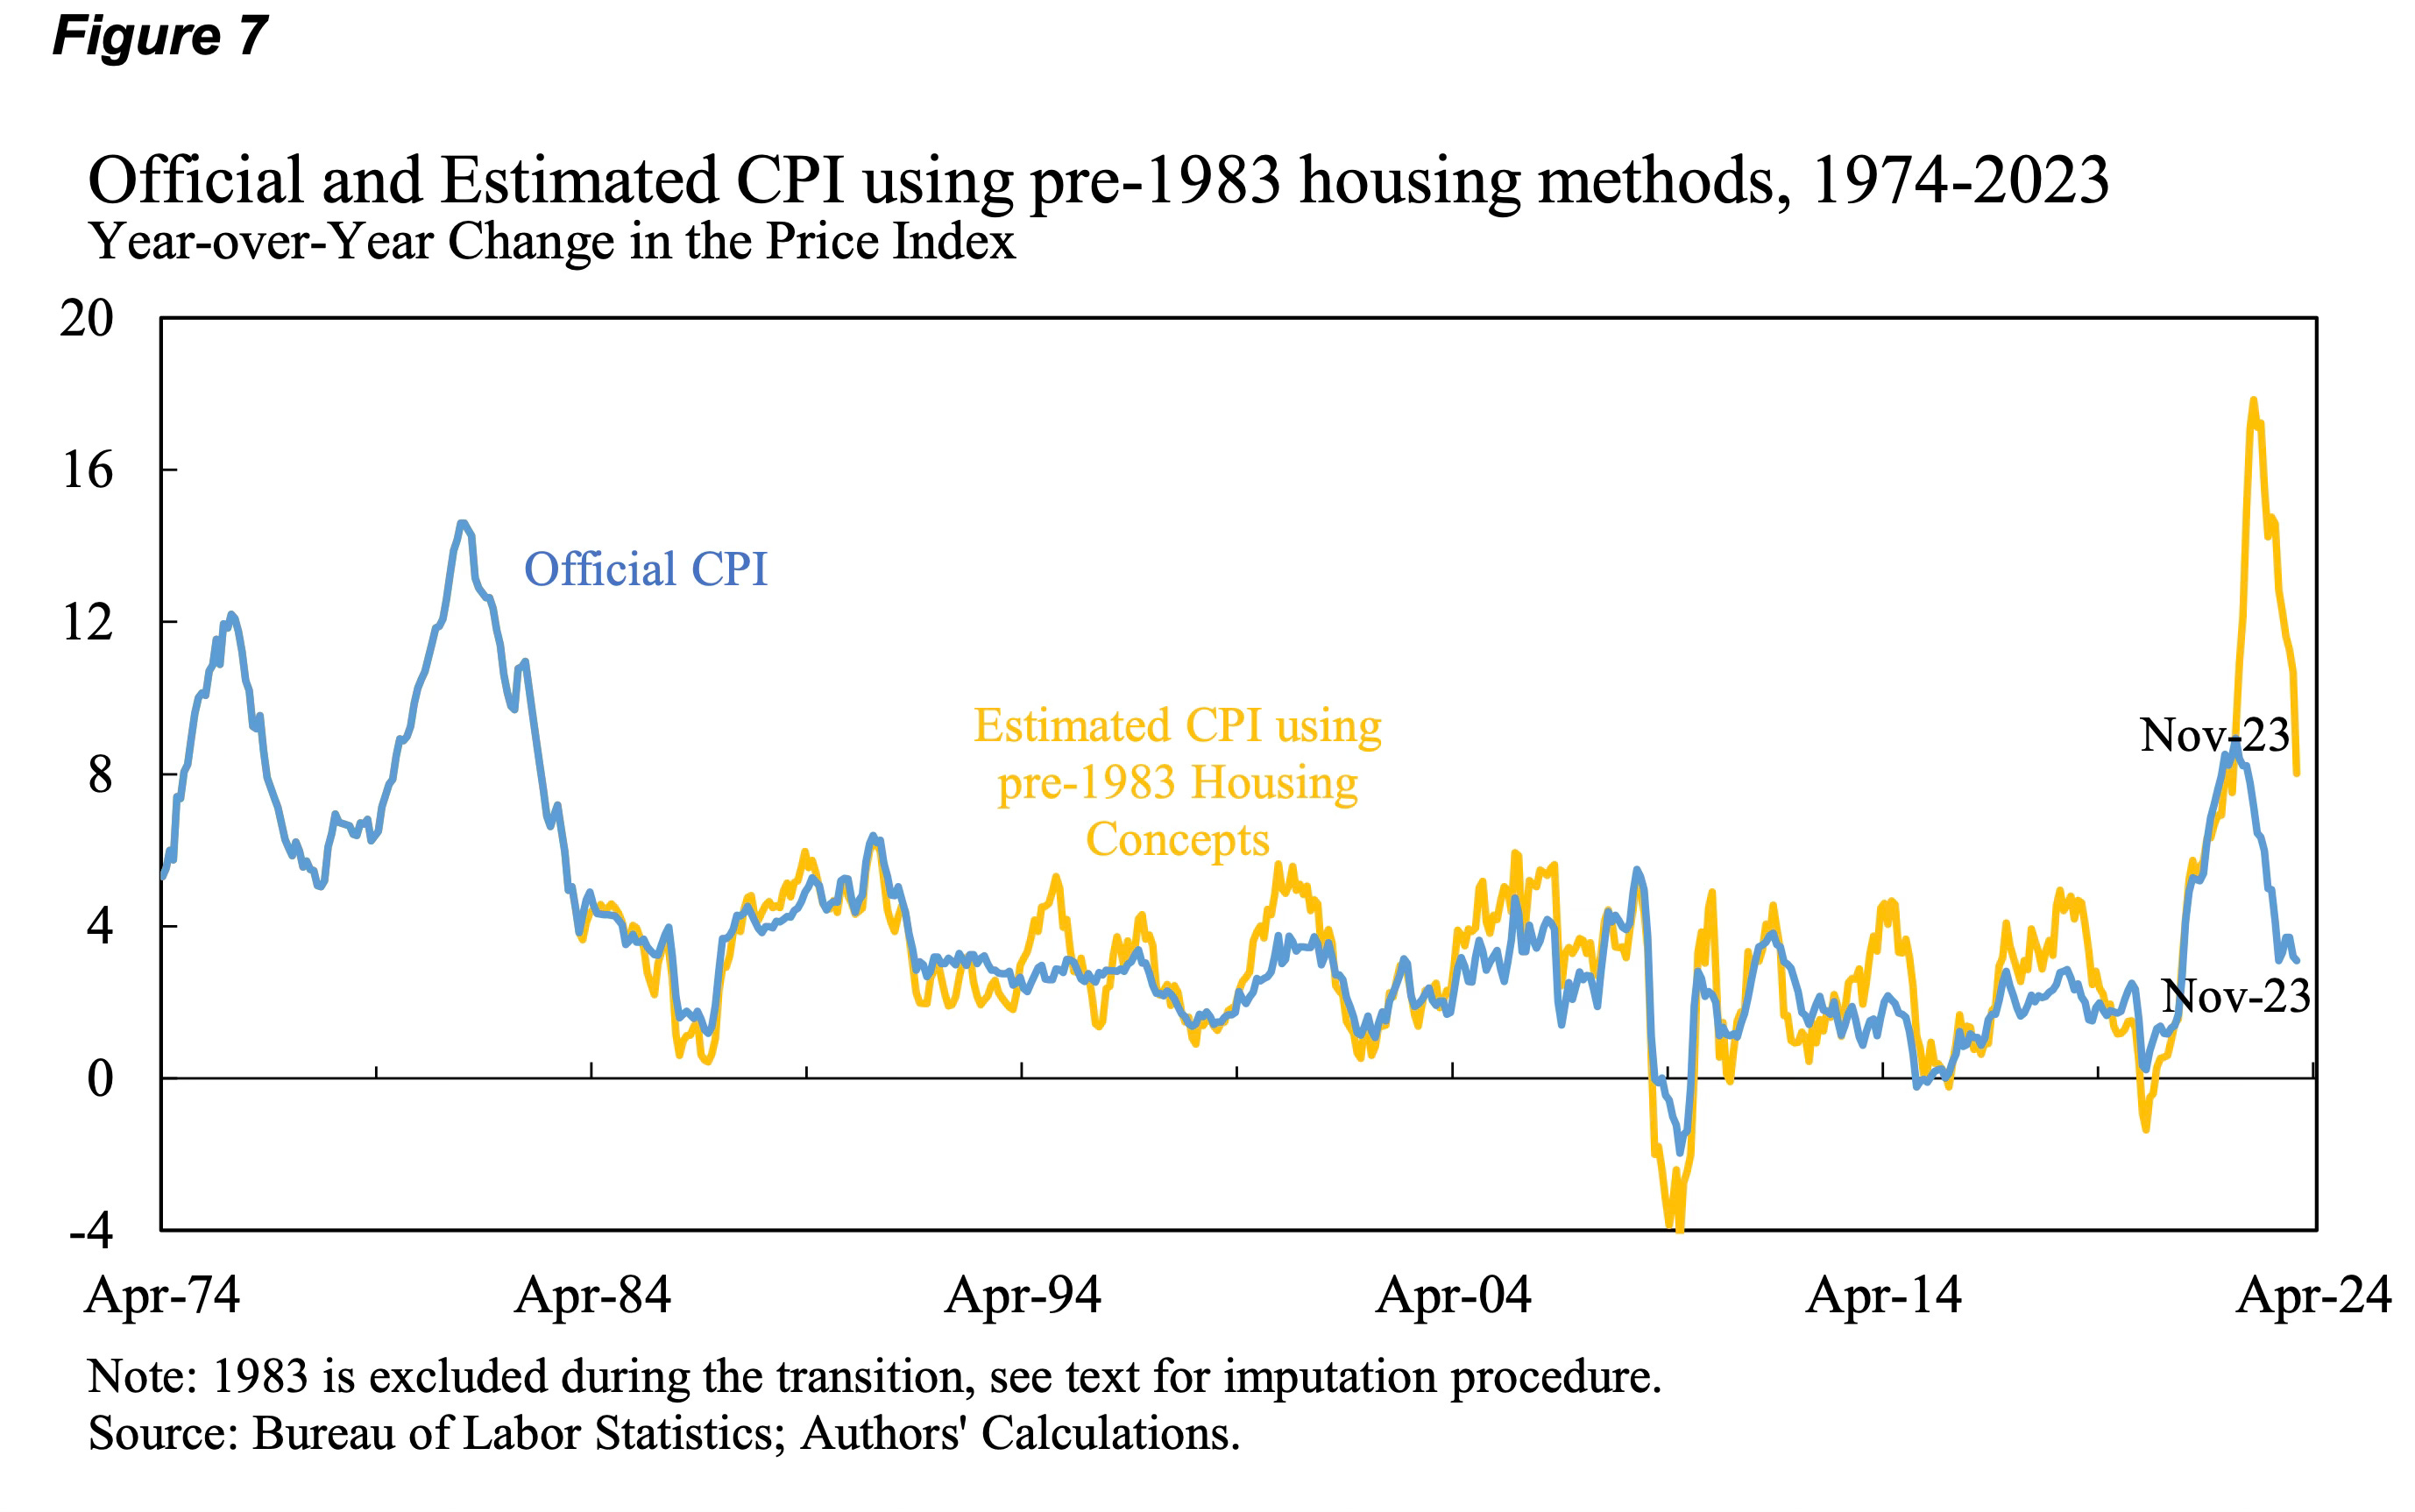
If we measured inflation as we did in the 1970s, the recent bout of inflation would have been even higher than the worst of the 1970s! No wonder the deplorables are ungrateful for Bidenomics, is essentially the author’s point, though quantified and much more politely stated.
The main difference is that the old measure counts the price and interest rate you have to pay to buy a new house as the cost of the house, while the new measure is based on what it costs to rent a house. You can see that the new and old methods are the same in the initial run up of inflation starting in 2021, but then the new measure shoots up when the Fed raised interest rates.
But the change in measurement makes it hard to compare over time. It would be nice to recompute the old data with new measurement. But when you can’t do that, computing new data with the old measurement is a nice way to compare over time on an even basis. Christina Romer wrote a nice paper using the same method. It seems like unemployment is less volatile after WWII than it was before 1930, which many authors have attributed to the wonders of Keynesian stabilization policy. But if you construct modern unemployment data using old methods, they look the same.
The authors generalize the idea by adding interest costs to buy cars and other goods in the cost of living:
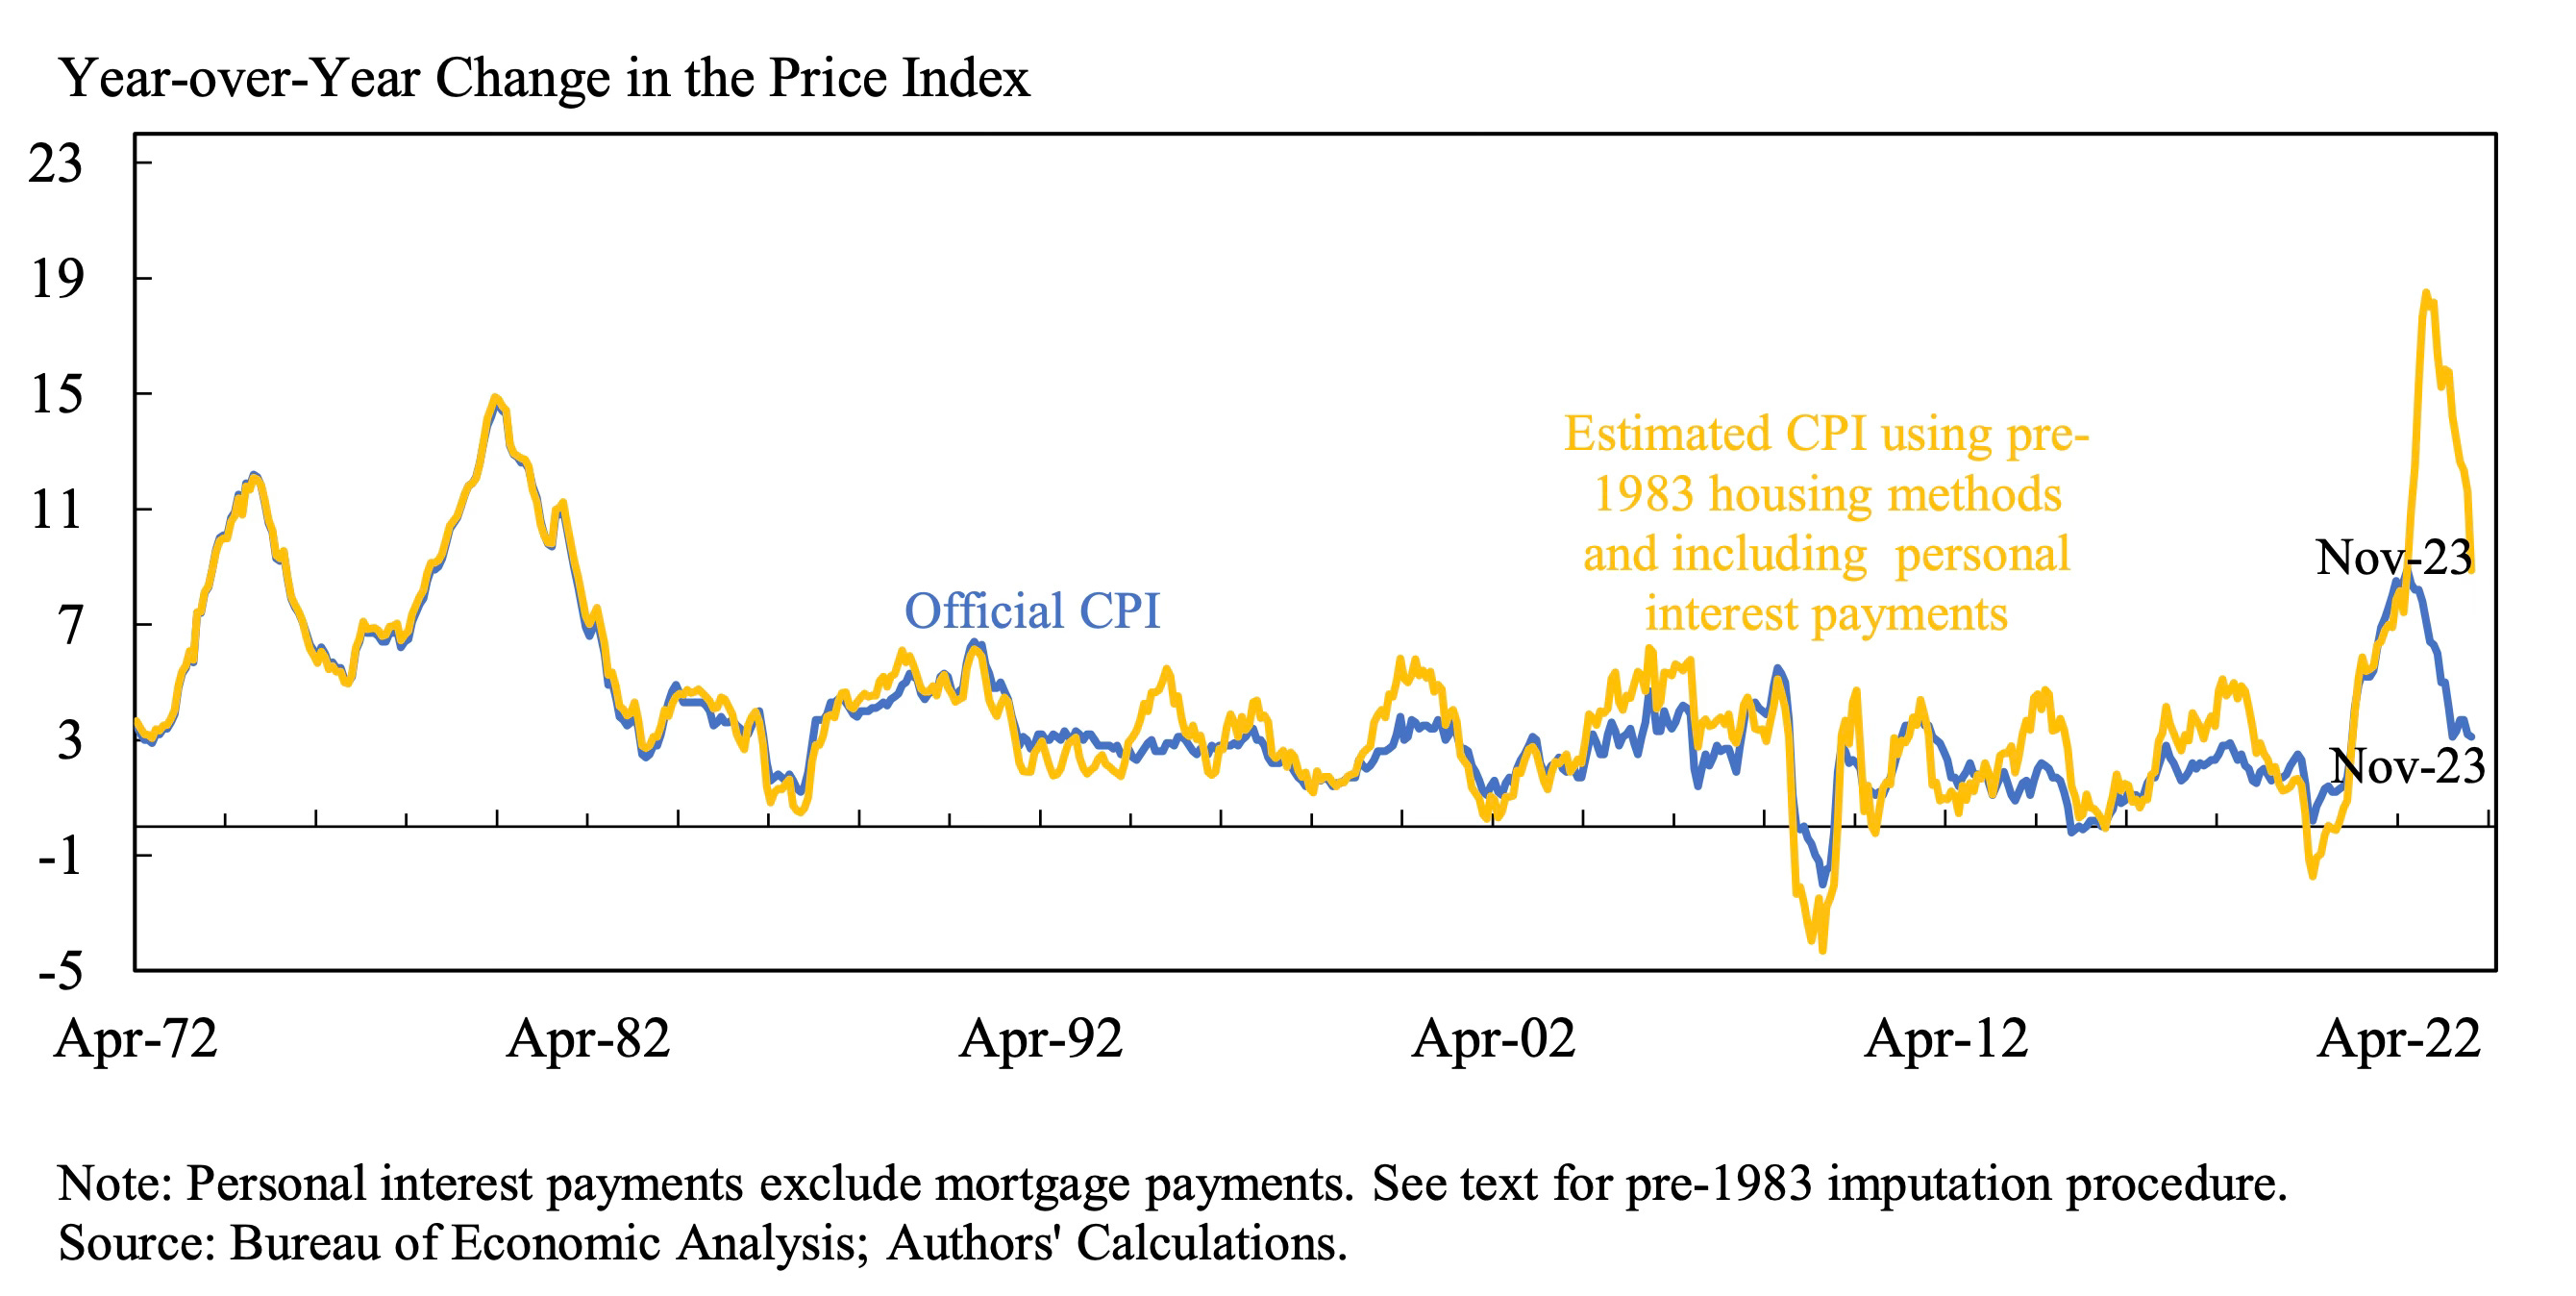
You can see it’s almost the same story.
What’s the right way to compute inflation?
The new way is closer to right, if the question is to measure changes in the cost of living right now for the average person. We tend to jump to answers without stating the question. Stating the question is a good idea.
Most people live in older houses with fixed mortgages, so higher prices and mortgage rates for new houses don’t affect them. People who rent don’t care. While higher interest rates are a cost to borrowers, and higher house prices a cost to buyers, higher interest rates are higher income to savers and higher house prices a boon to down-sizers. Those wash on average.
But to the average American, the idea that inflation is falling and they are better off because they could rent a house just like theirs for less money, is a bit of a head scratcher. To put it mildly. It’s right, economically. The homeowner is a landlord plus a renter. The “rent” the renter half of the homeowner is the cost of living. Lower rental income, higher interest or purchase costs of the landlord half is not part of the cost of living, as all business profits and capital gains and losses are not. Still, explain that to the average voter.
There are a couple of central problems here, with some unresolved economics. The CPI is essentially a static concept. It’s the cost of buying a typical basket of consumption goods. If you think apples, bananas, strawberries, that makes sense. But if you think cars, houses, and stocks, all of a sudden it doesn’t make that much sense anymore. The world isn’t static. The future matters. The right question might be, how much does it cost today to buy my lifetime consumption? [What does the full time and state-contingent consumption stream cost?] If rents are low, but house prices and interest costs are high, it’s likely that rents will rise in the future. (Yes. See this great recent paper by Fama and French.) Buying a house locks in the right to live there forever. The cost of a lifetime of housing did go up, though today’s rents did not.
Similarly, if stocks go up, that typically does not mean expected future dividends rise, so the cost of saving for retirement has risen. There is a lot of talk of “asset price inflation.” Economists (including me) usually sneer, that’s a relative price not the price level. Don’t repeat the common mistake of confusing a relative price for the overall level of prices. Don’t use the word “inflation” for car inflation, stock inflation, house inflation, and so forth. Those are individual, and usually relative prices. Inflation means the average level of all prices. Period. But “asset price inflation” isn’t necessarily wrong, it’s just an answer to a different question. If you want to know the cost of providing for a lifetime of consumption, higher asset prices and lower real interest rates mean that cost has risen. The consumer price index asks a different question. The lifetime consumption cost index would be a fun thing to calculate.
Similarly, we often look at different measures of inflation to try to forecast what properly measured inflation will be in the future. The core vs. headline argument comes down to this question. “Core” inflation ignores food and energy. Well, says the average person, it’s awfully nice that prices excluding food and energy aren’t rising so fast, but I have to eat and buy gas. Is it dishonest to report core, or the endless entrail reading of various components that goes on with every CPI report? No, if the question is to forecast what inflation will be in the future. There is a supposition that food and energy prices are “volatile.” Volatile really means predictable — a rise in price today can reliably forecast a decline in that price in the future. Then core is a better forecast of future inflation than headline inflation.
Another example: The BLS properly looks at the average rent people are currently paying. But rent is very sticky. Landlords don’t raise rent on existing houses and apartments nearly as quickly as they raise the rent on new leases. Thus, new rents are, I think, a good forecast of where average rents will be in the future.
I wish this idea were taken to its logical conclusion. If the question is, what is headline inflation going to be next year, then let’s examine carefully how the information in various components like core actually do in making such a forecast. My sense is that it can be done, but less precisely than most pundits think. Similarly, higher interest rates and house prices might well make sense as ingredients in forecasting next year’s rents and hence next year’s inflation.
Inflation dynamics
In the graphs, the standard (rental) measure of inflation turns around while the version that incorporates rentals keeps going up. That makes a big difference in how we measure inflation dynamics, the response of inflation to interest rates.
Background:
Inflation came seemingly from nowhere to most analysts. Summers and I think it was perfectly obvious — drop $5 trillion from helicopters and inflation breaks out. For Summers, that’s simple AS/AD: deficit x 1.5 > GDP gap. To me (fiscal theory) it is central that people do not expect surpluses to pay back that debt anytime soon. (More here, “fiscal narratives.”) I note speculatively that inflation really broke out in Feb 2021, which is plausibly when it became really clear that large deficits would continue. I think its easing was also perfectly obvious. A one-time fiscal shock gives a one-time price level rise. Inflation eases when that is done. The Fed helps, and higher interest rates temporarily lower inflation, but it’s not central.
The puzzle for standard analysis is that inflation eased just as the Fed started raising rates, long before rates exceeded inflation, and with no recession. Adieu Phillips curve.
There is also a big open question in empirical monetary economics: What is the effect of interest rate rises on inflation? Most estimates say inflation goes up gently for a year or two after a rate rise, before falling gently (maybe). In this context, inflation easing one month after the Fed gently started raising rates is nearly miraculous. Talk shifts to “expectations,” somehow this time a few basis points of short rate showed everyone just how tough the Fed would be.
Point:
The method of computing inflation with interest rates keeps going up, when the current measure turns around.
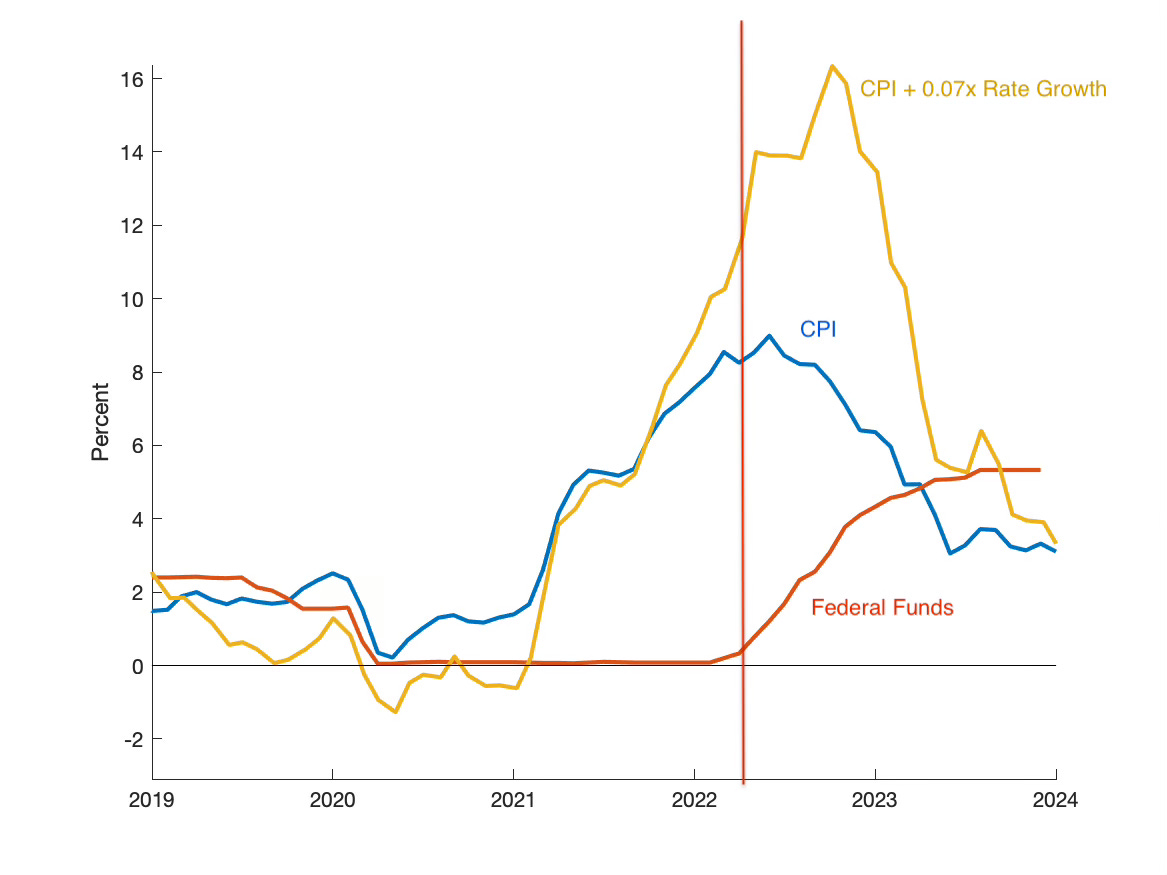
To give a sense of this, I did a very rough computation of the interest rate adjusted CPI by adding 0.07 times the growth of the 30 year mortgage rate to the CPI. I picked 0.07 so that the peak would be about the same as the authors’ peak.
Yes, I add growth rate of the mortgage interest rate, not the level. We’re measuring inflation, the rate at which prices rise, and the level of the mortgage interest rate is the relevant price. The level of the mortgage rate went up and stayed up. Cumulative inflation, the rise in the price level, is about double under the old measure. Average people are annoyed by the price level, not the inflation rate.
The vertical line marks “liftoff,” when the Fed started raising rates. You see the CPI turn around almost immediately. But since long term rates follow the Federal funds rate, the growth in mortgage rate peak a good deal later.
If you like the interest rate adjusted measure of CPI, you capture something quite common in the zeitgeist: Interest rates are a cost, and raising interest rates almost mechanically raises inflation for a while.
Conversely, maybe this observation shows a resolution of the “price puzzle” that historic estimates show inflation rising a while after interest rate rises. Maybe that was all spurious, and inflation really does turn around just as interest rates rise. Getting models to generate a delay has been devilishly hard, and to this day most modern (rational expectations, new Keynesian, forward looking) models say that inflation jumps down the minute interest rates rise. Maybe the models are (whew!) right after all.
Bottom line: much of measured inflation includes things like imputed home rents, government services, health care, and so on. That’s right, but don’t expect huge precision. It measures the change in the average consumption basket, but the relative price changes (home price relative to rent) affect different people differently, and a lot. It doesn’t measure lifetime consumption. It doesn’t really measure the value of the dollar, which is what the Fed should really be focusing on. There is a lot of interesting economics to be done in thinking about how to measure inflation. Just make sure to state the question before you jump to the answer!
Update.
Ricardo Reis already wrote a nice paper thinking about the cost of lifetime consumption, “A Dynamic Measure of Inflation.” Larry Summers has one too, in a nice paper “Observations on the Indexation of Old Age Pensions” that questions whether Social Security indexing is a good idea. Answer: probably not. There are other risks we might want to share between taxpayers and pensioners, one of them being changes in the real rate of interest that make a future consumption stream more expensive. The issue is related to whether wealth inequality is meaningful. If asset prices rise because interest rates fall, wealth inequality rises though the consumption streams that wealth can support are unchanged.
That's a very interesting post. If I may add a few comments to the discussion:
When considering whether asset prices should be included in the CPI, there are some theoretical arguments in favor of doing so (e.g., Alchian and Klein, 1973). Therefore, incorporating asset prices into the CPI might better capture the true change in the purchasing power of money over time.
However, there are significant practical challenges to implementing this approach. First, it would require including a wide range of assets beyond just stocks and real estate, such as small businesses, art, and even human capital, which are difficult to accurately value. Second, determining the appropriate weights for these assets in the index would be far more complex than the straightforward process of using expenditure surveys for a standard CPI.
Empirical studies, such as the one conducted by Filardo (2000), have found little evidence that including asset prices in the CPI would lead to better policy outcomes in the United States. While some researchers argue differently (e.g., Goodhart, 2001), I think that the overall literature does not provide strong support for the idea that incorporating asset prices into the CPI would significantly improve economic performance.
Interestingly, in the years that predate the Great Depression, the Fed used the Generalized Price Index, which somewhat included asset prices (Orphanides, 2003). This index pointed to elevated inflation and presumably contributed to the tightening that predated the crisis.
Clearly, if the primary concern is accounting for future inflation, there are already several established measures of inflation expectations, such as surveys of professional forecasters and consumers, which can provide valuable insights without the need to directly include asset prices in the CPI.
Are there measures of the inflation rate for different demographics? Different groups such as 20 somethings starting families and 60 somethings starting retirement clearly have different baskets of goods...
For example, I hear from young folks that buying a first home in most of the country is now essentially impossible without available damily wealth or 0.1% income. Their life satisfaction and trajectory is much more dependent on housing, including interest, costs than for the majority of rising retirees who typically already own their own home...